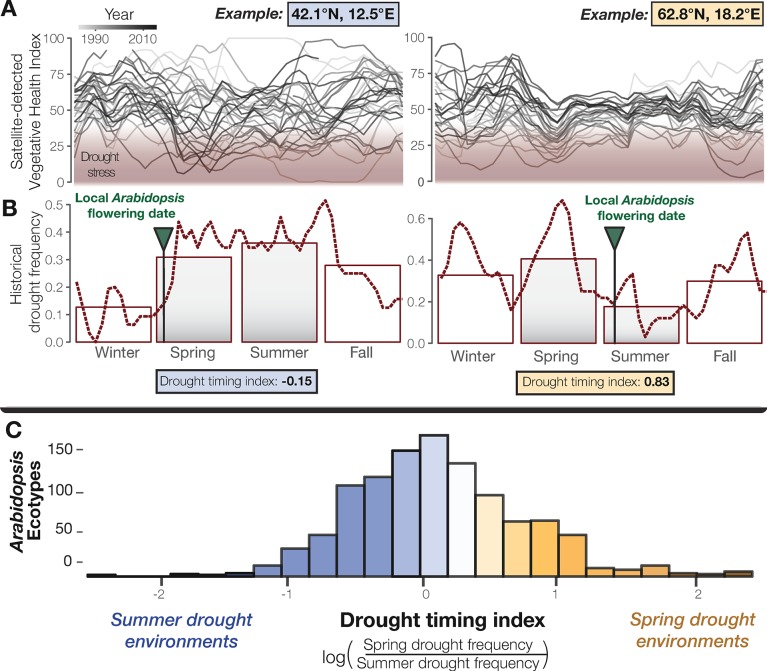
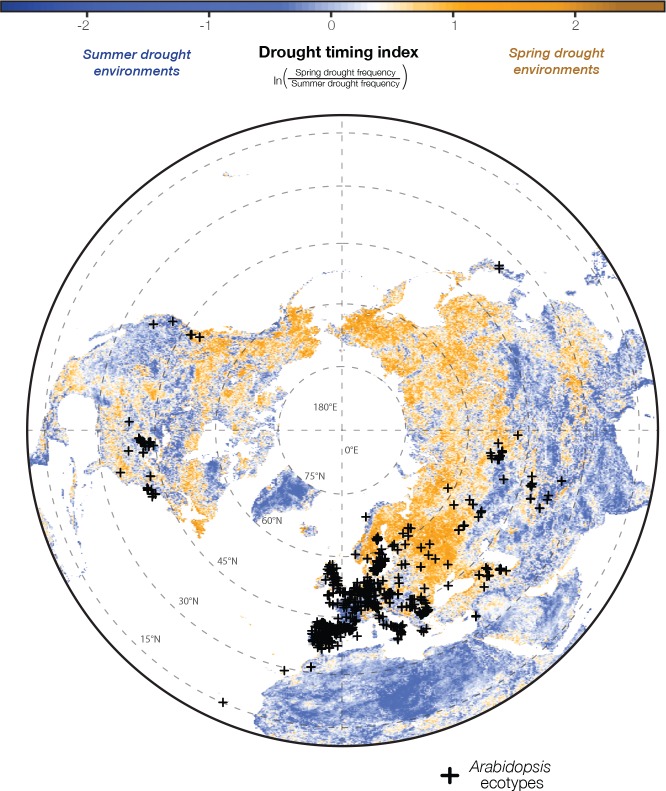
Figure 1. Seasonal drought timing varies across the Arabidopsis species range.
(A) Examples of home environments for two well-studied Arabidopsis ecotypes (Mojica et al., 2016) from Italy and Sweden, left and right plots respectively, showing historical drought conditions detected using the VHI and (B) drought frequency (VHI <40, NOAA drought classification) by week (line) and season (bars). Arrows mark locally observed flowering dates (Mojica et al., 2016) and gray bars highlight the typical reproductive growing season used to quantify a drought-timing index. (C) Variation in historical drought timing experienced at the home environments of Arabidopsis ecotypes across the species range (figure supplement). Large values indicate environments where spring droughts occur more frequently than summer drought (i.e. where the frequency of drought decreases over the course of the typical reproductive growing season) and vice versa.


