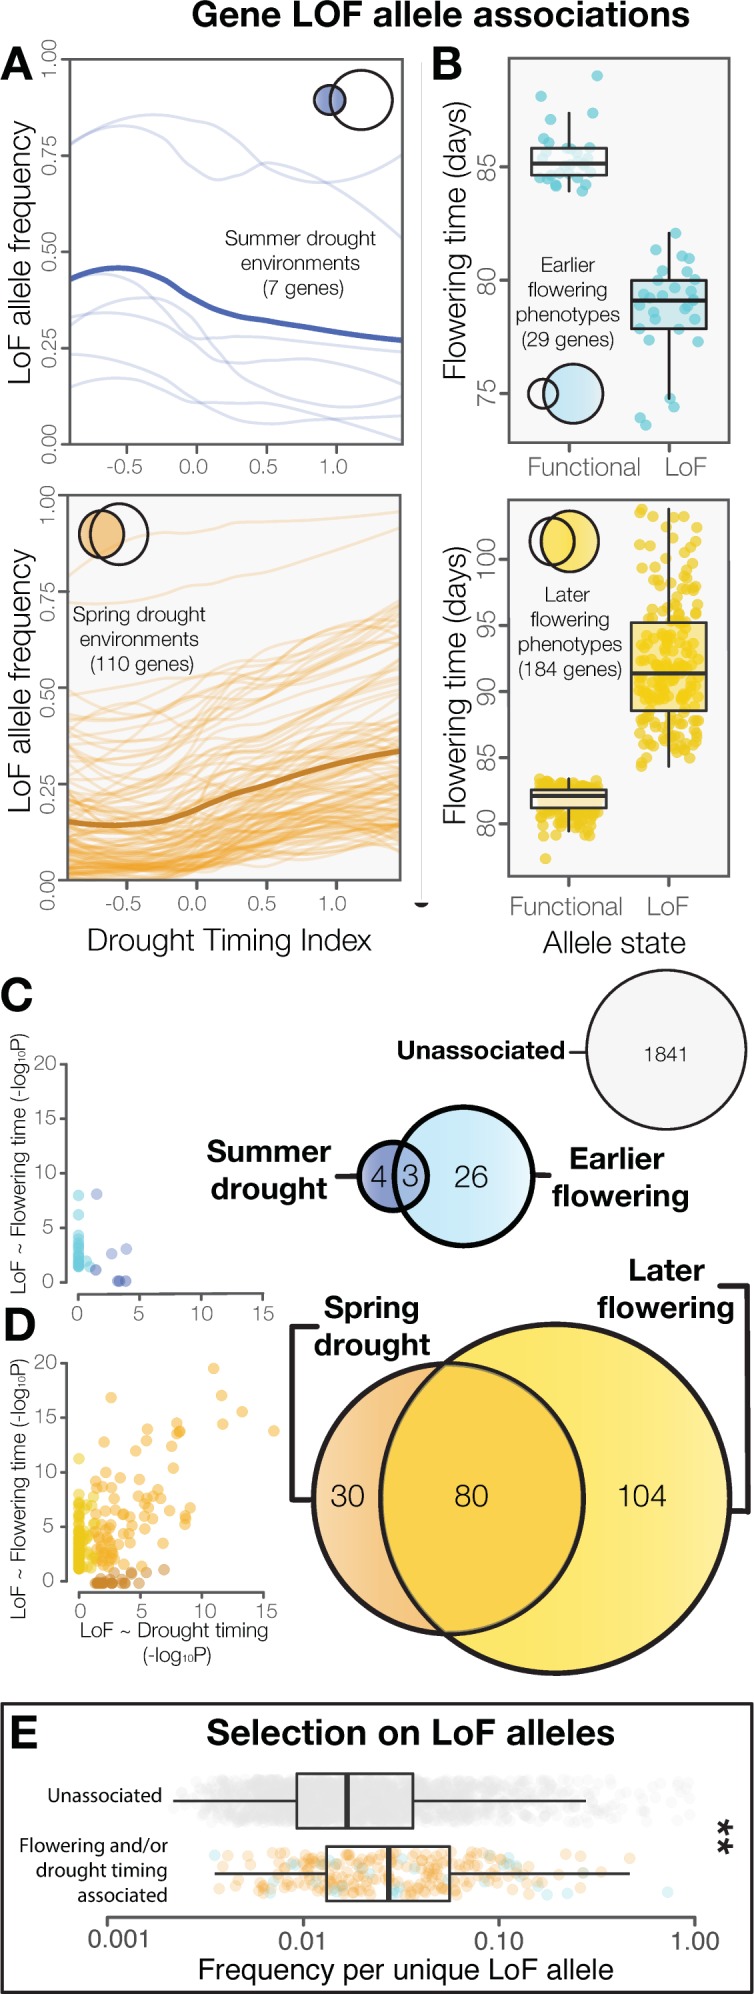
Figure 2. LoF alleles share associations between drought timing and flowering time, exhibit evidence of positive selection.
(A) Visualization of the frequency of LoF alleles across environments in genes associated to summer (upper) or spring drought environments (lower). Darker lines indicate the mean across genes. (B) Contrasting flowering times between ecotypes with functional versus LoF alleles in genes associated with earlier (upper) or later (lower) flowering time phenotypes. (C) Overlap and relationships between the strength of LoF allele associations in genes associated with summer drought and earlier flowering, and (D) spring drought and later flowering. (E) Increased frequencies of independent LoF alleles in genes associated with drought timing and/or flowering time compared to genes without detected associations (t-test, p = 3.4 × 10⁻⁷), a signature of recurrent mutation accompanied by positive selection (Pennings and Hermisson, 2006).

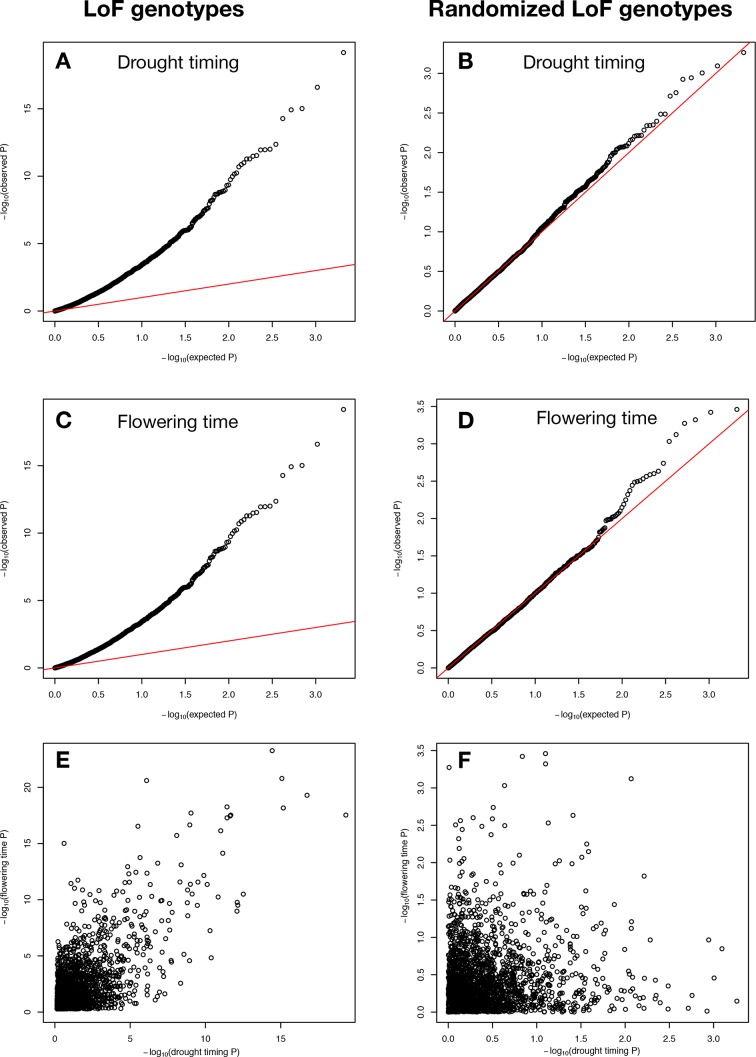
Figure 2—figure supplement 1. P values of LoF allele associations.
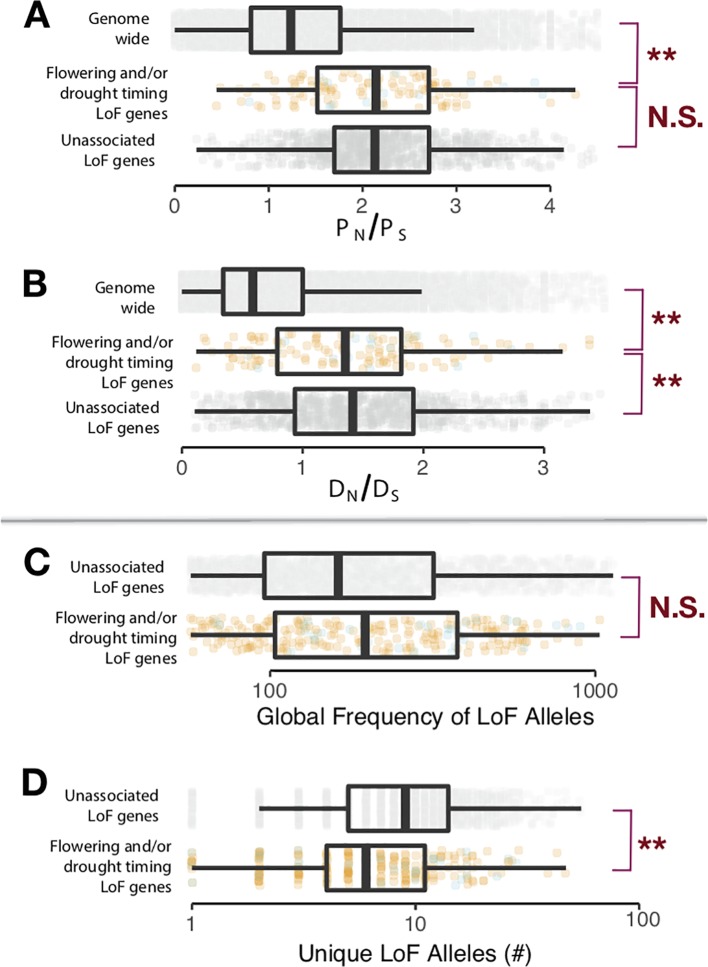
Figure 2—figure supplement 2. Signatures of selection on LoF genes identified differ from null expectations.
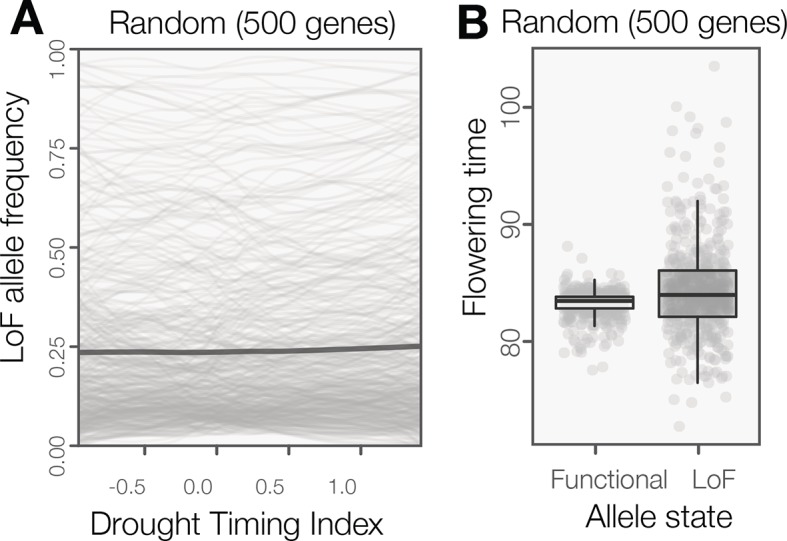
Figure 2—figure supplement 3. LoF alleles are not broadly overabundant in Arabidopsis ecotypes originating from spring drought environments or flowering later.


