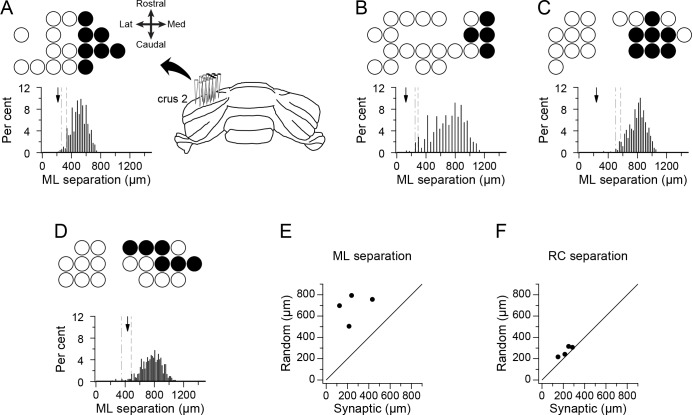
Figure 3. PCs identified by correlogram analysis as projecting to the same DCN neuron form spatially restricted groups.
(A–D) Schematics showing recording arrays from four experiments. Circles indicate positions of recorded PCs; filled circles indicate positions of PCs identified as presynaptic to the recorded DCN cell. The histogram below each schematic shows the distribution of the mean mediolateral separation among cells from groups having the same number of cells as the presynaptic group but whose locations on the array were randomly chosen. Arrow indicates the mean separation value for presynaptic group in each experiment. The dashed and dash-dotted lines indicate the 5% and 1% percentiles, respectively. (E) Scatter plot of the mean mediolateral separation of PCs in the presynaptic group versus the mean of the distribution for the random groups. (F) Same as (E) except that the separation in the rostrocaudal direction is plotted. Note that each experiment shown in panels A-D will be referred to throughout the paper and in other figures with reference to their panel designation in this figure.

