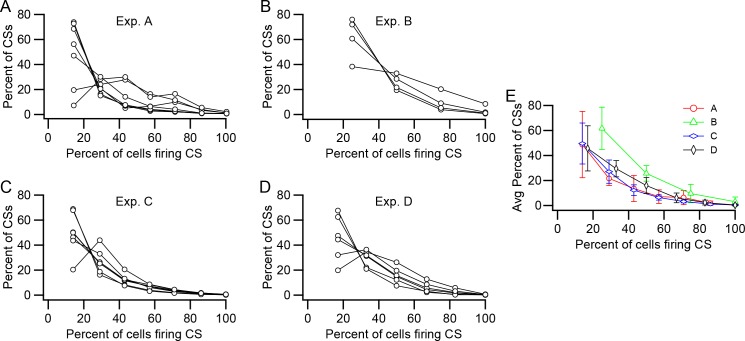
Figure 5. Relative prevalence of synchronous CS activity.
(A–D) Plots of the percent of CSs at each synchrony level (Percent of cells firing CSs) within the presynaptic group. Each panel shows data from one experiment. Each curve shows the distribution of CSs for one PC in the presynaptic group. The number of PCs in each group is as follows: A, 7; B, 4; C, 7; D, 6. (E) Average distribution for each experiment.

