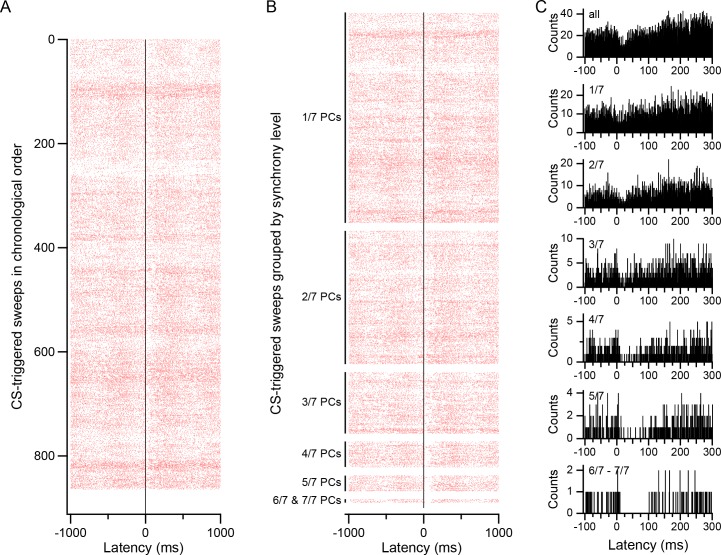
Figure 6. CS-associated modulation of DCN activity.
(A) CS-triggered raster display of DCN activity. The raster was generated from all CSs of one PC during a 20 min recording (firing rates: CS, 0.70 Hz; DCN cell, 30 Hz). Each row represents the activity surrounding one CS. The rows are arranged in chronological order (top to bottom). (B) Raster of same data as in A, but CSs are first grouped according to synchrony level, as indicated by labels on y-axis. Within each synchrony level the rows are arranged chronologically. In particular, note how the inhibition of DCN activity just after the CS (latency = 0 ms) increases with synchrony. (C) CS-triggered histograms of DCN activity for different synchrony levels. Top histogram (all) generated from all CSs and corresponds to the entire raster in A and B. The remaining histograms were generated from their corresponding groups in the raster of panel B. Note the expanded time scale compared to the rasters in order to highlight the change in the inhibition that follows the CS, and the transient excitation just preceding the CS (visible in bottom four histograms).

