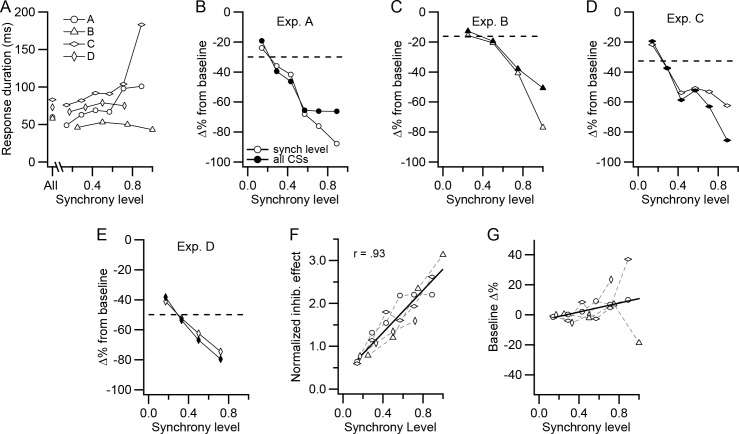
Figure 7. CS-associated inhibition of DCN activity is a function of synchrony.
(A) Duration of post-CS inhibition is plotted as a function of synchrony level for each experiment. The durations were determined from histograms generated from the CS activity of all PCs in a presynaptic group. The points plotted above 'All' are durations determined from the histogram generated from all CSs. The other points were generated from all CSs at a particular synchrony level. (B–E) For each experiment, the percent change in DCN activity during the post-CS inhibition period from baseline activity is plotted as a function of synchrony level. The time of the response period was set either based on the All-CS histogram (filled circles) or by measurement of the duration on the specific synchrony level histograms (unfilled circles). Dashed lines indicate the change in activity measured from the All-CS histogram. (F) Comparison of the effect of synchrony across all experiments. The 'all CSs' curves in panels B-E were normalized by dividing each by the corresponding average synchrony for that experiment (horizontal dashed line in each panel). Symbols for experiments are the same as in panel A. Solid line is least squares regression line. (G) Change in the level of the baseline activity with synchrony. Histograms were normalized for number of CSs, and then baseline activity at each synchrony level was compared to the baseline level for the All-CS histogram. In some of the experiments, the highest synchrony levels were combined because there were too few events (<10) at the highest levels to analyze. In these cases, the synchrony level was set to a weighted average of the combined levels: experiments A and C, levels 6-7/7; experiment D, levels 4-6/6. No levels were combined for experiment B. Solid line is least squares regression line.

