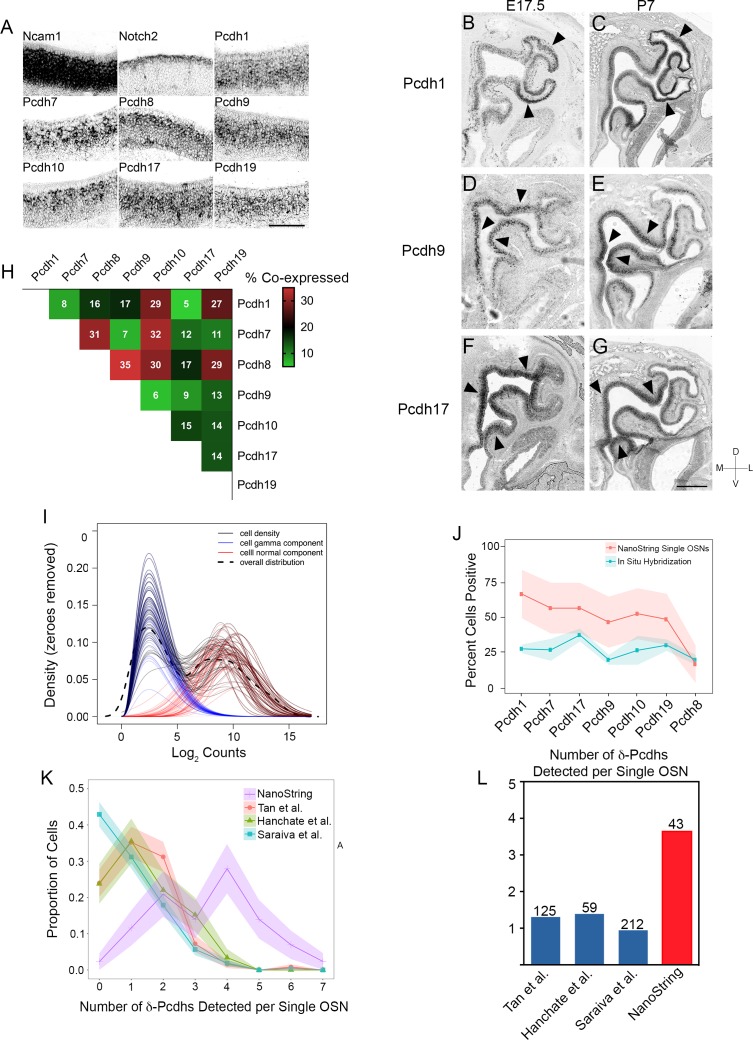
(A) Single color RNA in situ hybridization of Ncam1 (a marker of OSNs), Notch2 (a marker of non-neuronal sustentacular cells), and δ-Pcdhs in P7 olfactory epithelium. Note punctate expression of δ-Pcdhs. Scale bar, 100 μm. Pcdh11x and Pcdh18 could not be detected. (B–G) Single color RNA in situ hybridization of Pcdh1, Pcdh9, and Pcdh17 in E17.5 (B,D,F) and P7 (C,E,G) olfactory epithelia. Arrowheads indicate areas of enriched regional expression. Scale bar, 400 μm for (B,D,F) and 500 μm (for C,E,G). (H) Confocal analysis of a round robin double label RNA in situ hybridization series from E17.5 olfactory epithelia. Values indicate percent overlap in OSNs for any given pair. Pcdh11x and Pcdh18 could not be detected with this approach. (I) Constrained gamma-normal mixture modeling was used to determine if expression of a given gene was ‘on’ or ‘off’ within a given cell. Each line represents a density plot from the model for a single cell. Blue curves represent the lowly expressed component (e.g. ‘off’), which was allowed to vary in relative proportion but with constant mean and variance parameters. Red curves represent the highly expressed component (e.g. ‘on’) as a normal distribution with variable mean and variance parameters. The dashed curve represents the sample density of all cells across all genes. (J) Ribbon plot comparing percentage of OSNs expressing a given δ-Pcdh as determined by NanoString (red line) and quantification of RNA in situ hybridization signal (blue line). Similar trends were observed for both methods, suggesting enzymatic dissociation during OSN isolation did not greatly alter δ-Pcdh expression. Shaded regions represent 95% CI. (K) Ribbon plot comparing δ-Pcdh expression in single OSNs as detected by NanoString and three different single OSN RNA-seq studies. Data from RNA-seq studies were re-analyzed using the constrained gamma-normal mixture modeling approach. Cells were first filtered based on positive gene expression of Ncam1 to parallel the selection of Ncam1 positive OSNs used in this study. The three single OSN RNA-seq studies follow similar distributions, with the majority of OSNs expressing zero or one δ-Pcdh. In contrast, the NanoString dataset detects more δ-Pcdhs per cell. Ribbons represent standard deviation following repeated bootstrapping of samples. (L) Mean number of δ-Pcdhs per OSN from single cell RNA-seq datasets and NanoString. Numbers above bars represent the number of Ncam1 positive cells in each study.


