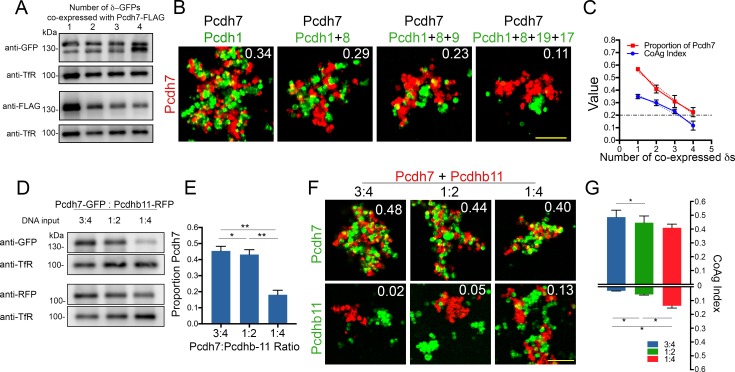
Figure 7. Effect of increasing co-expression of δ-Pcdhs on adhesion and interactions with clustered Pcdhb11.
(A) Western blot showing surface expression of Pcdh7 (FLAG) in the presence of increasing numbers of co-expressed δ-Pcdhs (all labeled with GFP). (B) Representative images of Pcdh7 cells when mixed with Pcdh7 +increasing numbers of δ-Pcdhs. Note shift from intermixing (left panel) to interfacing (right panel) as the number of δ-Pcdhs increases. Scale bar, 100 μm. (C) Linear regression analysis of mean CoAg values (R2 = 0.94; blue) and relative surface expression of Pcdh7 (red) with increasing numbers of co-expressed δ-Pcdhs. Error bars indicate ±SEM. Results for each assay were determined from three independent electroporations. Dot-dash line indicates boundary between intermixing and interfacing. R2 = 0.97 and 0.98 for CoAg index and proportion of Pcdh7 on surface, respectively. (D) Western blot of Pcdh7 and Pcdhb11 surface expression with varying DNA input ratios. (E) Quantitation of western blot data shown in (D). Error bars indicate ±SEM. Results for each assay were determined from three independent electroporations. (F) Representative images and (G) Mean CoAg values of coaggregation assays with Pcdh7+Pcdhb11 cells. As the ratio of Pcdh7:Pcdhb11 decreases, the CoAg value of Pcdhb11 cells increases, and shifts from segregation to interfacing (compare bars on bottom half of graph). Although the CoAg values of Pcdh7 drop somewhat (compare bars on top half of graph), Pcdh7 cells still intermix, despite low DNA input ratios. Error bars indicate ±SEM, * indicates p≤0.05. Results for each assay were determined from three independent electroporations. Scale bar, 100 μm.


