. 2019 Jan 9;8:e42940. doi: 10.7554/eLife.42940

Figure 2. 2BAct prevented myelin loss and reactive gliosis in the brain and spinal cord of R191H mice.

(A) Representative IHC images of the corpus callosum. Scale bar, 250 μm. Inset is magnified 2X. Inset scale bar, 100 μm. (B) Quantification of staining in (A). Area of positive staining expressed as μm2. (C) Representative IHC images of the lower cervical/upper thoracic region of the spinal cord. Scale bar, 500 μm. Inset is magnified 6.8X. Inset scale bar, 50 μm. (D) Quantification of staining in (C). For (B) and (D), N = 12 mice/condition (6 males and six females combined; no significant sex differences were detected). Error bars are SD. *p<0.05; ***p<10-4; nsp>0.05 by 1-way ANOVA with Holm-Sidak pairwise comparisons.

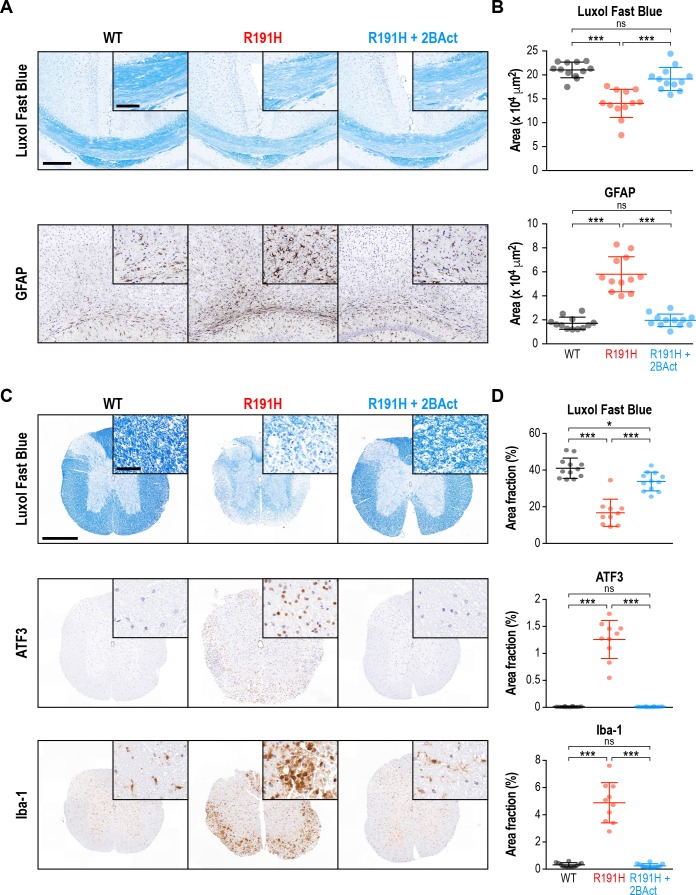
Figure 2.

Figure 2—figure supplement 1. 2BAct prevented myelin loss and reactive gliosis in the brain and spinal cord of R191H mice.

Figure 2—figure supplement 1.

(A) Representative MBP staining in the corpus callosum. Scale bar, 250 μm. Inset is magnified 2X. Inset scale bar, 100 μm. (B) Quantification of staining in (A). Area of positive staining expressed as μm2. (C) Representative IHC images of the lower cervical/upper thoracic region of the spinal cord. Scale bar, 500 μm. Inset is magnified 6.8X. Inset scale bar, 50 μm. (D) Quantification of staining in (C). For (B) and (D), N = 12 mice/condition (6 males and six females combined; no significant sex differences were observed). Error bars are SD. *p<0.05; **p<10−3; ***p<10-4; nsp>0.05 by 1-way ANOVA with Holm-Sidak pairwise comparisons.
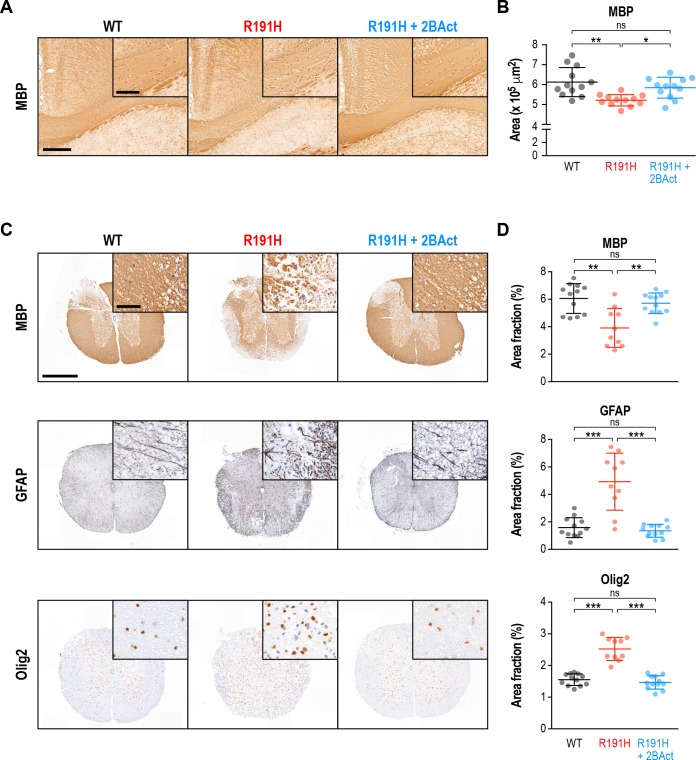
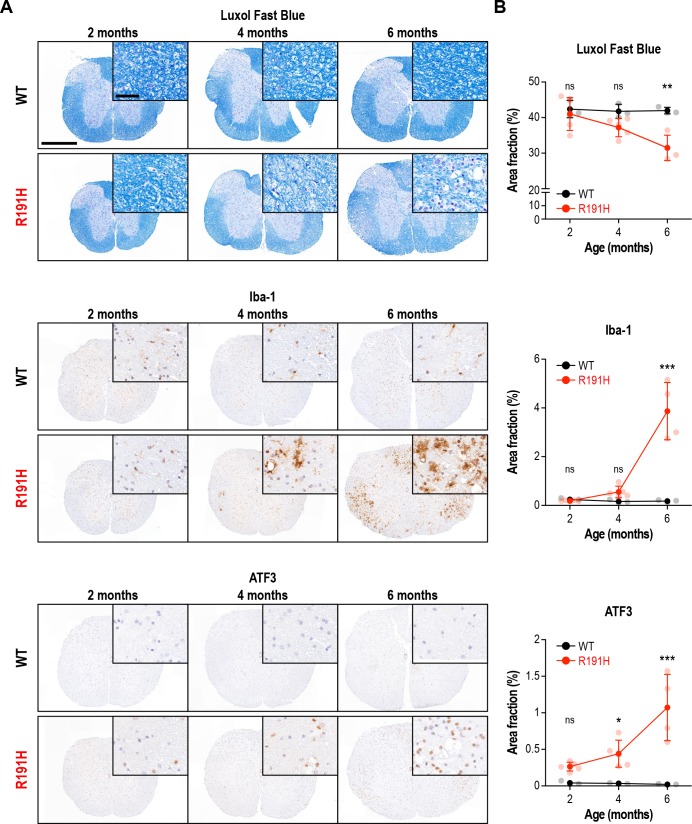
Figure 2—figure supplement 2. Age-dependent myelin loss and inflammation in the spinal cord of R191H mice.

Figure 2—figure supplement 2.

(A) Representative IHC images of the lower cervical/upper thoracic region of the spinal cord of female mice at 2, 4 and 6 months of age. Scale bar, 500 μm. Inset is magnified 6.8X. Inset scale bar, 50 μm. (B) Quantification of staining in (A). N = 3 (2 mo WT), 5 (2 mo R191H), 3 (4 mo WT), 5 (4 mo R191H), 3 (6 mo WT), 4 (6 mo R191H) females. Error bars are SD. *p<0.05; ***p<10-4; nsp>0.05 by 2-way ANOVA with Holm-Sidak correction.