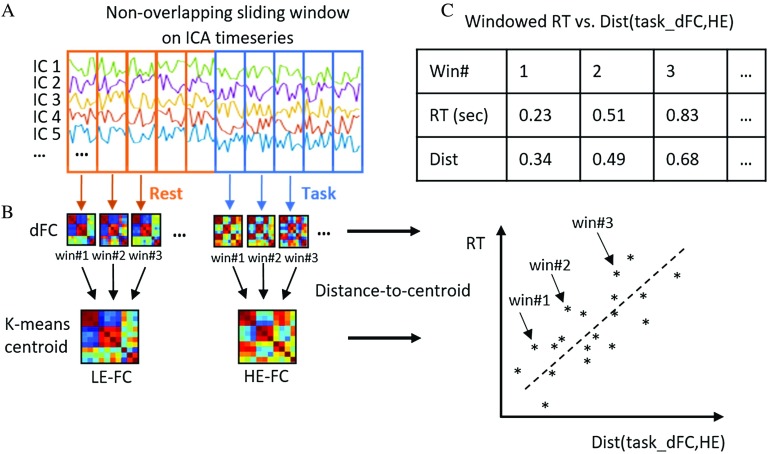
Figure 1. .
Schematic of the analysis pipeline. (A) dFC patterns were first computed using the windowed time series, obtained via group ICA, as input. (B) Unsupervised k-means clustering was then applied on the vectorized dFCs to obtain representative HE-FC or LE-FC patterns. (C) Distance between task-dFCs and the corresponding task-specific HE-FC pattern defined as dist(task_dFC, HE) are plotted against RT. A significant positive relationship between the two variables should be observed if our hypothesis holds.

