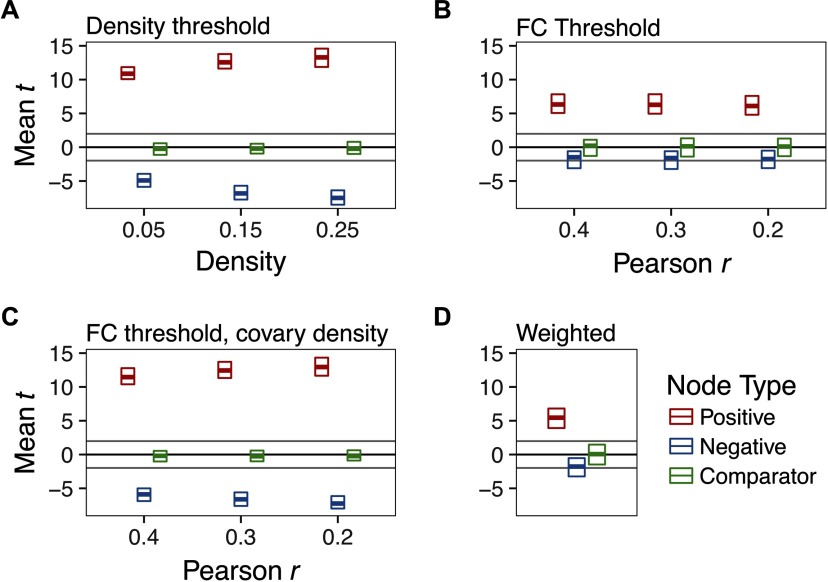
Figure 2. .
The effect of thresholding method on group differences in degree centrality when there is strong hyperconnectivity in three randomly selected nodes (Positive) and weak hypoconnectivity in three nodes (Negative). Three unaffected nodes are depicted for comparison (Comparator). For parameters of this simulation, see Supporting Information Table S1 (Hallquist & Hillary, 2018), Whack-a-node hyperconnectivity. The central bar of each rectangle denotes the median t statistic (patient–control) across 100 replication datasets (patient n = 50, control n = 50), whereas the upper and lower boundaries denote the 90th and 10th percentiles, respectively. The dark line at t = 0 reflects no mean difference between groups, whereas the light gray lines at t = −1.99 and 1.99 reflect group differences that would be significant at p = .05. (A) Graphs binarized at 5%, 15%, and 25% density. (B) Graphs binarized at r = {.2, .3, .4}. (C) Graphs binarized at r = {.2, .3, .4}, with density included as a between-subjects covariate. (D) Strength centrality (weighted graphs).

