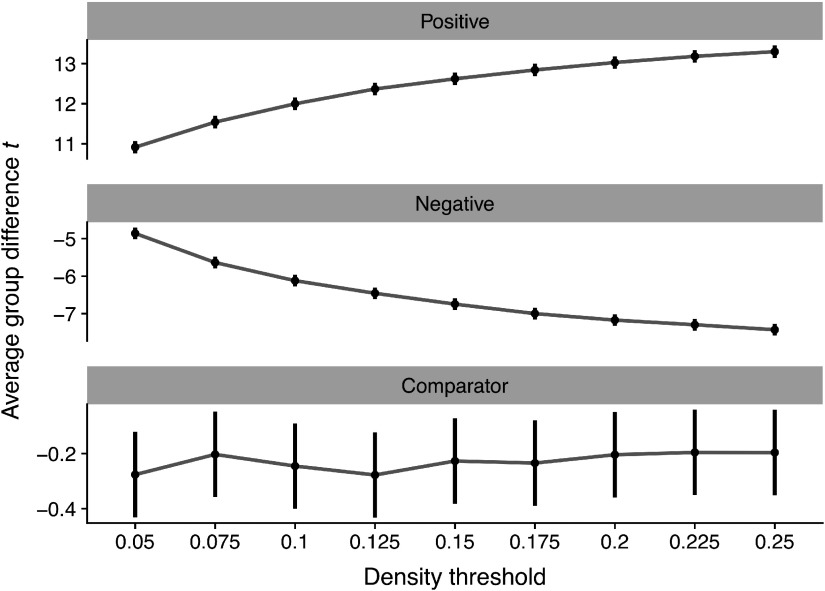
Figure 3. .
The effect of density threshold on group differences in degree centrality. Dots denote the mean t statistic at a given density, whereas vertical lines denote the 95% confidence interval. All statistics reflect group differences in degree centrality computed on graphs binarized at different densities.

