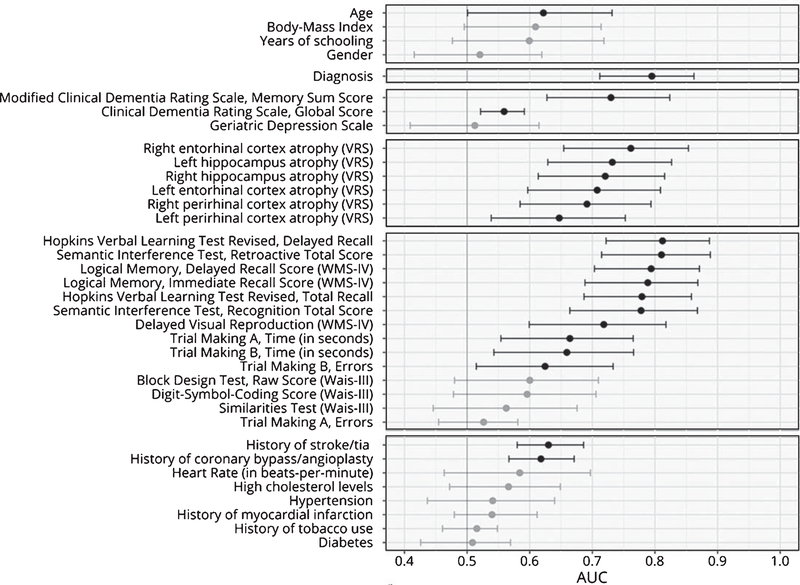
Fig. 2.
AUC of individual predictors. The figure indicates the cross-validated AUC and its 95% bootstrap CI when prediction is made by each single predictor. Predictors are grouped according to conceptual domains, in descending order sociodemographic information, diagnosis, clinical scores, brain atrophy, cognitive measures and cardiovascular risk index. Non-significant AUC (i.e., lower bound of the CI lower than or equal to 0.5) are in grey, significant ones in black.

