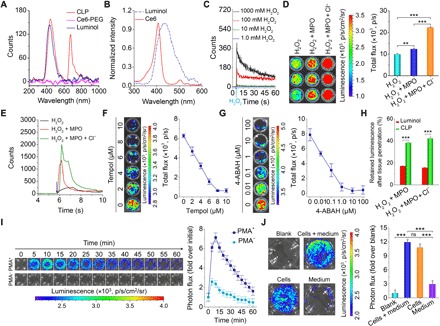
Fig. 2. In vitro characterization of BRET and luminescent properties of the CLP conjugate.

(A) Luminescent spectra of a CLP conjugate, a Ce6-PEG conjugate, and luminol in the presence of 100 mM H2O2 and 100 mM ClO−. (B) The luminescence spectrum of luminol in PBS and the absorption spectrum of Ce6 in DMSO. (C) Time-dependent luminescence of CLP (0.5 mg/ml) upon incubation with various concentrations of H2O2. (D and E) Luminescence at 1.0 mg/ml CLP (D) and time-resolved luminescent signals of CLP at 0.5 mg/ml (E) in the presence of 50 μM H2O2 with or without 15 mU MPO and 50 mM Cl−. (F and G) Attenuation of the luminescence at 0.5 mg/ml CLP and in the presence of 50 μM H2O2 and 15 mU MPO by a ROS scavenger, Tempol (F), and an MPO inhibitor, 4-aminobenzoic hydrazide (4-ABAH) (G). (H) In vitro tissue penetration capacity of luminol and CLP. After a black 96-well plate containing CLP or luminol at the same dose of 0.5 mg/ml was covered with 3 mm of porcine muscle tissue, the penetrating luminescent signals were determined. (I) Time-resolved luminescence imaging of neutrophils. Immediately after 5.4 μM CLP (i.e., 25 μg/ml) was incubated with neutrophils (5 × 10⁵ cells per well) with (PMA+) or without (PMA−) stimulation with phorbol 12-myristate 13-acetate (PMA; 100 ng/ml ) for 1 hour, images were acquired at predetermined time points. (J) Intracellular and extracellular luminescent signals. The Blank group indicates neutrophils stimulated with PMA and without treatment with CLP nanoparticles. After PMA-stimulated neutrophils were incubated with 5.4 μM CLP for 0.5 hours, luminescence images were acquired and indicated as the Cells + medium group. Immediately after this imaging, cells and the culture medium containing PMA were separated, and images were separately collected for the Cells and Medium groups. For all luminescence imaging results (D, F, G, I, and J) measured with an IVIS Spectrum imaging system [exposure time = 5 min, focal length/stop (f/stop) = 1, binning = 8, field of view (FOV) = 12.8 cm], the left panels are luminescent images, while the right panels show quantitative data. Data in (D) and (F) to (J) are means ± SEM. (n = 3). One-way analysis of variance (ANOVA) was used for statistical analysis. **P < 0.01, ***P < 0.001; ns, no significance.
