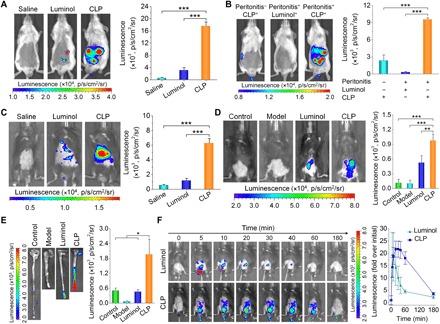
Fig. 3. In vivo imaging in mouse models of inflammation.

(A) Luminescent imaging of mice with peritonitis immediately after intraperitoneal administration of different formulations. To induce peritonitis, a saline solution containing 1 mg of zymosan was intraperitoneally injected into each mouse at 6 hours before imaging. Mice in the saline group were treated with saline, while those in the CLP and luminol groups were each administered with 5 mg of CLP nanoparticles or free luminol at the same dose of the luminol unit, respectively. (B) Luminescence imaging of peritonitis in mice at 0.5 hours after intravenous injection of different probes. In the Peritonitis−CLP+ group, healthy mice were treated with CLP nanoparticles. Peritonitis mice in the Peritonitis+Luminol+ and Peritonitis+CLP+ groups were administered with free luminol and CLP nanoparticles (5 mg in each mouse) at the same dose of the luminol unit, respectively. (C) Imaging of acute liver injury in mice at 24 hours after challenging via intraperitoneal injection of acetaminophen at 300 mg/kg. Mice in the saline group were intravenously injected with saline, while mice in the luminol and CLP groups were separately intravenously administered with free luminol and CLP nanoparticles (5 mg in each mouse) at the same dose of the luminol unit. After 0.5 hours, imaging was conducted. (D) In vivo luminescence imaging of mice with colitis induced by drinking water containing 3% (w/v) dextran sulfate sodium (DSS) for 7 days. (E) Ex vivo luminescent images of colonic tissues isolated immediately after in vivo imaging. In both cases, the control group represents healthy mice treated with CLP nanoparticles, while the model group denotes diseased mice administered with saline. In the luminol and CLP groups, mice with colitis were treated with free luminol and CLP nanoparticles (5 mg in each mouse) at the same dose of the luminol unit per mouse, respectively. At 15 min after different treatments via enema, luminescent images were acquired. Then, the mice were euthanized, and their colonic tissues were excised for ex vivo imaging. (F) Time-lapse in vivo luminescence imaging of mice with DSS-induced colitis after local administration of 5 mg of CLP nanoparticles or free luminol at the same dose of the luminol unit in each animal. In all images, the left panels show representative luminescent images, while the right panels illustrate quantified intensities. Data are means ± SEM (A to C and F, n = 4; D and E, n = 5). One-way ANOVA was used for statistical analysis. *P < 0.05, **P < 0.01, ***P < 0.001.
