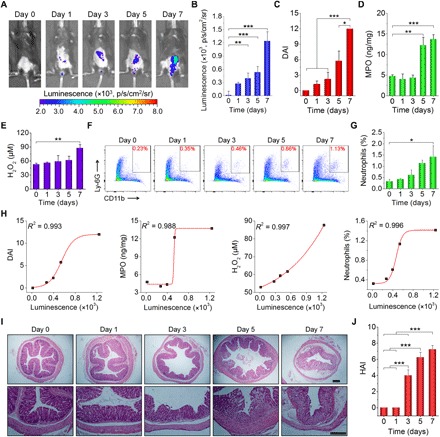
Fig. 4. In vivo luminescence imaging of the development of colitis in mice.

(A and B) Luminescent images (A) and quantitative analysis (B) of mice with colitis induced by drinking water containing 3% (w/v) DSS for different periods of time. For each time point, images were acquired at 15 min after enema administration of 5 mg of CLP nanoparticles in each mouse. (C to E) Changes in DAI (C) and the levels of MPO (D) and H2O2 (E) during colitis development. DAI is defined as the summation of the stool consistency index, fecal bleeding index, and weight loss index. Colonic tissues were excised from mice subjected to drinking water containing DSS at specific time points to quantify MPO and H2O2 levels. (F and G) Representative flow cytometric profiles (F) and quantitative data (G) of neutrophil counts. At different time points after mice were treated with drinking water containing DSS, they were euthanized, and cells in colonic tissues were isolated for analysis. (H) Correlation analyses of luminescent intensities with DAI, MPO, and H2O2 levels and neutrophil count. All data were fitted with a sigmoid growth function. (I and J) Microscopic images (I) and HAI scores (J) of H&E-stained sections of colonic tissues isolated from mice stimulated with DSS for different periods of time. Scale bars, 200 μm. Data in (B) to (E), (G), and (J) are means ± SEM (n = 4). One-way ANOVA was used for statistical analysis. *P < 0.05, **P < 0.01, ***P < 0.001.
