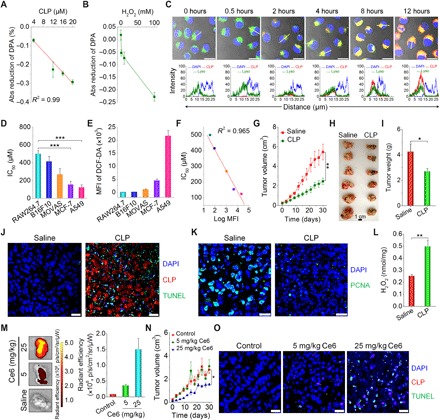
Fig. 5. In vitro and in vivo antitumor activity of CLP nanoparticles.

(A and B) The effects of CLP dose (A) and H2O2 concentration (B) on the generation of 1O2, as quantified using DPA as a probe. In both cases, the images show the reduction in DPA absorbance at 355 nm using that at 0 hours as the baseline. For the dose effect, quantification was performed after CLP nanoparticles were incubated with 100 mM H2O2 for 6 hours. To examine the influence of the H2O2 concentration, absorbance was measured after 6 hours of incubation with 20 μM CLP nanoparticles. (C) Confocal microscopy images illustrating time-dependent endocytosis of CLP nanoparticles in A549 lung carcinoma cells. Images in the lower panel display quantitative analysis of fluorescent intensities corresponding to indicated yellow lines in single cells of the upper fluorescence images. After A549 cells were cultured with 10.8 μM CLP nanoparticles for predetermined time periods, nuclei were stained with 4′,6-diamidino-2-phenylindole (DAPI), while endolysosomes were labeled with Lyso. Scale bars, 20 μm. (D) The half-maximal inhibitory concentration (IC50) values of different cells [including RAW264.7 murine macrophages, B16F10 mouse melanoma cells, MOVAS (mouse vascular aortic smooth muscle cell), MCF-7 human breast cancer cells, and A549 cells] after incubation with various doses of CLP nanoparticles for 24 hours. (E) Quantification of intracellular ROS levels in different cells by flow cytometry. After cells were incubated with 10 μM DCF-DA for 20 min and washed with PBS, measurements were performed. The ROS level is proportional to the mean fluorescence intensity (MFI) of a fluorescent probe DCF-DA. (F) Correlation between IC50 values and ROS levels. (G) Changes in tumor volume during treatment by intratumoral administration of saline or CLP nanoparticles at 3.25 mg/kg of Ce6 every 3 days in nude mice bearing A549 xenografts. (H and I) Digital photos (H) and quantified tumor weight (I) of excised tumors at day 30 after different treatments. (J) DAPI and TUNEL (terminal deoxynucleotidyl transferase–mediated deoxyuridine triphosphate nick end labeling) double-labeling assay of cell apoptosis in paraffin sections. (K) Immunofluorescence analysis of proliferating cell nuclear antigen (PCNA) in tumor sections. (L) The ROS level in tumor tissues after treatment via intratumoral injection of saline or CLP nanoparticles. (M) Ex vivo fluorescence images (left) and quantitative data (right) of the distribution of CLP nanoparticles in A549 xenografts. At day 7 after the last intravenous injection of CLP nanoparticles at 5 or 25 mg/kg of Ce6, tumors were excised for imaging. (N) Tumor volume changes during treatment with intravenously administered saline or CLP nanoparticles at 5 or 25 mg/kg of Ce6. The control group was treated with saline. (O) DAPI/TUNEL double-labeling assay of apoptotic cells in tumor sections after 30 days of treatment with saline or CLP nanoparticles. Scale bars, 20 μm. Data are means ± SEM (A, B, D, E, and L to N, n = 4; G and I, n = 6). *P < 0.05, **P < 0.01, ***P < 0.001. (Photo credit: Huijie An, Third Military Medical University).
