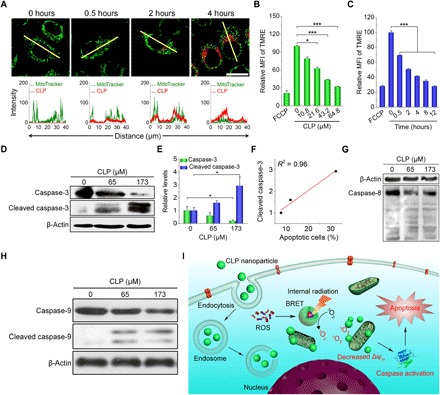
Fig. 6. In vitro mechanistic studies of the antitumor activity of CLP nanoparticles in A549 cells.

(A) Confocal microscopy images showing the mitochondrial localization of CLP nanoparticles. Images in the lower panel display quantitative analysis of the fluorescent intensities in the single cells as highlighted by the yellow lines in the upper fluorescence images. After cells were incubated with 10.8 μM CLP nanoparticles for different periods of time, mitochondria were stained with MitoTracker Green FM (MitoTracker). Scale bar, 20 μm. (B and C) The effects of the CLP nanoparticle dose (B) and incubation time (C) on mitochondrial membrane potential as analyzed by flow cytometry using a fluorescent probe tetramethylrhodamine ethyl ester (TMRE). For the dose-response experiments, cells were incubated with different doses of CLP nanoparticles for 12 hours, while they were cultured with 64.8 μM CLP to examine the time effect. FCCP (carbonyl cyanide p-trifluoromethoxy phenylhydrazone) was used as a positive control that can effectively depolarize the mitochondrial membrane potential. (D and E) Representative Western blot bands (D) and quantitative analysis (E) of total and cleaved caspase-3 in A549 cells after treatment with different doses of CLP nanoparticles for 24 hours. (F) Correlation between the percentage of apoptotic cells and the level of cleaved caspase-3. (G and H) Western blot analysis of total and cleaved caspase-8 (G) and caspase-9 (H) in A549 cells after 24 hours of incubation with CLP nanoparticles. (I) Schematic illustration of the antitumor mechanisms of CLP nanoparticles. Data are means ± SEM (n = 3). *P < 0.05, ***P < 0.001.
