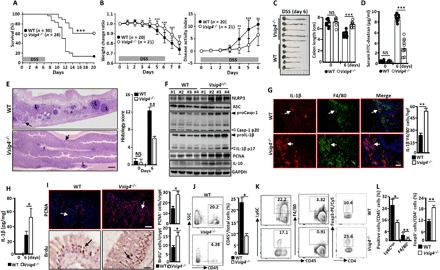
Fig. 5. Vsig4−/− mice are resistant to DSS-induced colitis.

Mice were given 3.5% DSS in their drinking water for 6 days to induce colitis. (A) The survival rate was assessed and compared daily for a total of 20 days. Data of five independent experiments with similar results were merged. (B) Comparative analysis of body weight and disease activity index. Data of four independent experiments with similar results were merged. Mice were euthanized at day 6 of DSS feeding. (C) The colon lengths were calculated and compared. (D) Mice were gavaged with FITC-dextran; these mice were euthanized after 3 hours, and sera were collected to detect the FITC-dextran amounts (each circle represents an individual mouse). (E) H&E staining analysis of histopathological changes (left) and semiquantitative scoring of histopathology (right). The asterisk indicates severe edema/inflammation, the arrows indicate the normal epithelium, and L indicates large lymphoid nodules. Scale bar, 300 μm (n = 15 per group). (F) Colonic homogenates were immunoblotted for the indicated molecules (each number represents an individual mouse). (G) In situ immunofluorescence analysis of IL-1β expression in F4/80+ macrophages. Scale bar, 20 μm. Arrows indicate positive cells, and blue indicates nuclear DAPI staining. (H) ELISA analysis of IL-1β in colonic homogenate. (I) In situ immunofluorescence analysis of PCNA expression and immunohistochemistry analysis of BrdU incorporation. Arrows indicate positive cells, and blue indicates DAPI. Scale bar, 20 μm. (J) Representative flow cytometry plots for CD45+ leukocytes infiltrating colonic tissues (left), and the percentages of CD45+ cells/total cells were compared (n = 10 per group). (K) Representative flow cytometry plots for CD45+F4/80+ macrophages, CD45+Ly6C+ monocytes, and Foxp3+CD4+T cell infiltrating colonic tissues. (L) The percentages of indicated cells within colonic tissues were compared (n = 10 per group). Error bars indicate SEM. *P < 0.05, **P < 0.01, and ***P < 0.001. (A) was analyzed by a log-rank test, and others were compared by Student’s t test. Data presented in (E) to (L) were analyzed at day 6 of DSS treatment.
