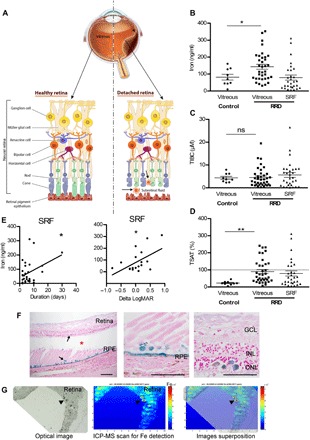
Fig. 1. Iron accumulates during RD in humans.

(A) Schematic representation of RRD. RPE strictly interacted with PRs (rods and cones), supporting their function and maintaining retinal physiology. During RRD, separation of the neural retina from the RPE disrupts the metabolism of PRs and induces permanent cellular damage, SRF accumulation through the retinal tear (arrowhead), and inflammatory cells in subretinal space. (B to D) Iron level (B), total iron binding capacity (TIBC) (C), and transferrin saturation (TSAT) (D) were quantified in vitreous from control patients and in vitreous and SRF from patients with RRD. Unpaired t test (n = 9 to 35 for vitreous and n = 30 for SRF), *P = 0.046 and **P = 0.006. ns, not significant. (E) Iron level in SRF was correlated to duration of the RRD (n = 30) and to the visual recovery 1 month following surgical treatment (n = 10). Pearson correlation test, *P < 0.05. (F) Perl’s staining (blue) on retinal sections from patients with nonhemorrhagic RD (asterisk shows space between retina and underlying RPE) revealed iron deposits in the retina and the RPE (arrows). Scale bars, 500 μm. (G) Iron distribution map realized by inductively coupled plasma mass spectrometry (ICP-MS) on the retina from a patient with nonhemorrhagic RD revealed iron deposits (arrowheads). An optical image of the analyzed retina section (left), the corresponding ICP-MS image of Fe distribution (medium), and the superposition of both (right). The color spectrum represents an ion intensity map of Fe. GCL, ganglion cell layer; INL, inner nuclear layer; ONL, outer nuclear layer; m/z, mass/charge ratio; ppm, parts per million. All values are represented as the mean ± SEM.
