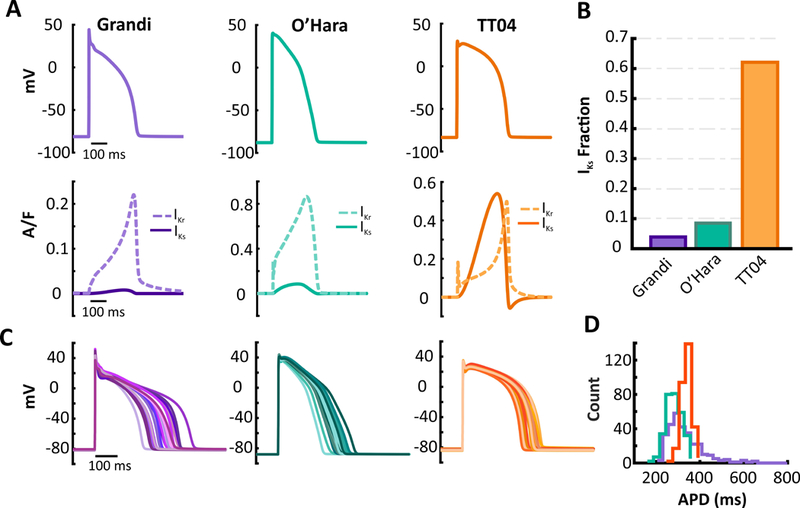
Figure 3. Dramatic differences seen between two human myocyte models in K+ currents and population variability.

(A)Graphs of AP, IKs, and IKr waveforms in the Grandi (purple), O’Hara (turquoise – replotted from Figure 1 for comparison), and the TT04 (orange) models under baseline conditions. Plots show the 100th beat simulated at a 1 Hz pacing rate. (B) TT04 model has higher levels of IKs or IKs Fraction than the O’Hara and Grandi models. (C) Representative APs from a population of 300 model variants generated by imposing random variability in parameters in the Grandi, O’Hara (replotted from Figure 1 for comparison)and TT04 models. (D) Comparison of the distribution of APD from the 300 model variants. Greater variability is seen in the Grandi model.
