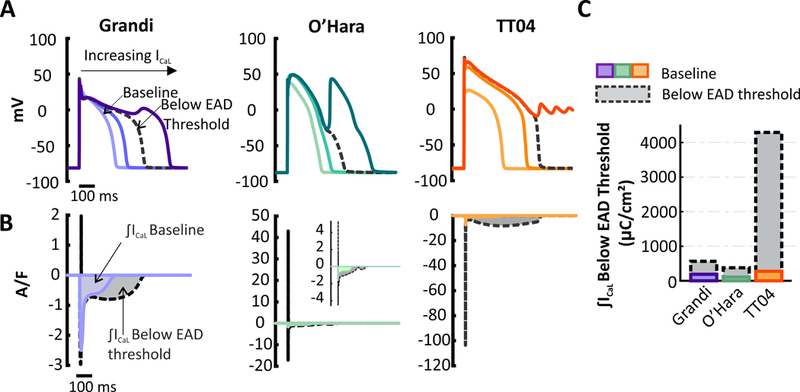
Figure 4. Susceptibility to Early Afterdepolarizations (EADs) in Grandi and TT04 models.

(A) APs simulated in Grandi (purple), O’Hara (turquoise), andTT04 (orange) models with different degrees of ICaL current augmentation. Plots represent the 91st beat at 1-Hz pacing rate. (B)ICaL waveforms in the two models. The colored curves show the baseline ICaL whereas the black dashed curves plot ICaL immediately before the first EAD occurred. The shaded regions illustrate the area under the curve (AUC). (C) Bar graph of the current AUCs from (B) show that small increases in ICaL induce EADs in the O’Hara and Grandi models(lower IKs models) whereas large increases are required to induce EADs in TT04 (high IKs model).
