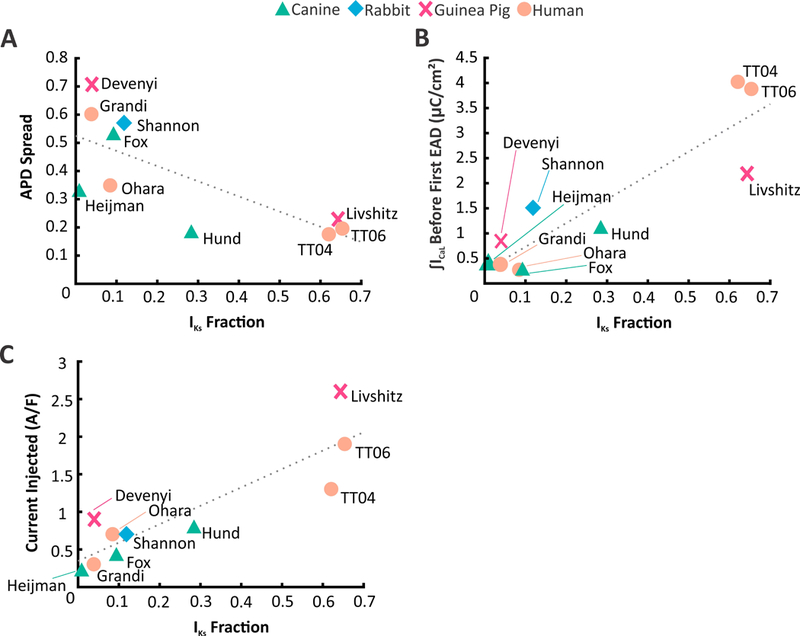
Figure 5. Comparison of population variability & susceptibility to EADs across models from multiple species.

(A) APD Spread plotted against IKs Fraction of ten ventricular myocyte models from four different species. APD Spread assesses the APD distribution of the populations developed in Figures 3&S2. It is defined as the difference of the 90th Percentile and 10th Percentile divided by the median. Models with low IKs have greater population variability than models with high IKs. (B) Integrated ICaL levels just below the EAD threshold (calculated in Figures 5& S4) plotted against IKs Fraction. Low IKs models were more susceptible to EADs than high IKs models.(C) Injecting constant inward current into each model, when the Vm is above –60 mV, induced arrhythmic behavior to different extents. Similar to (B) models with low IKs were more sensitive to a slight injection of inward current as compared to models with high IKs.
