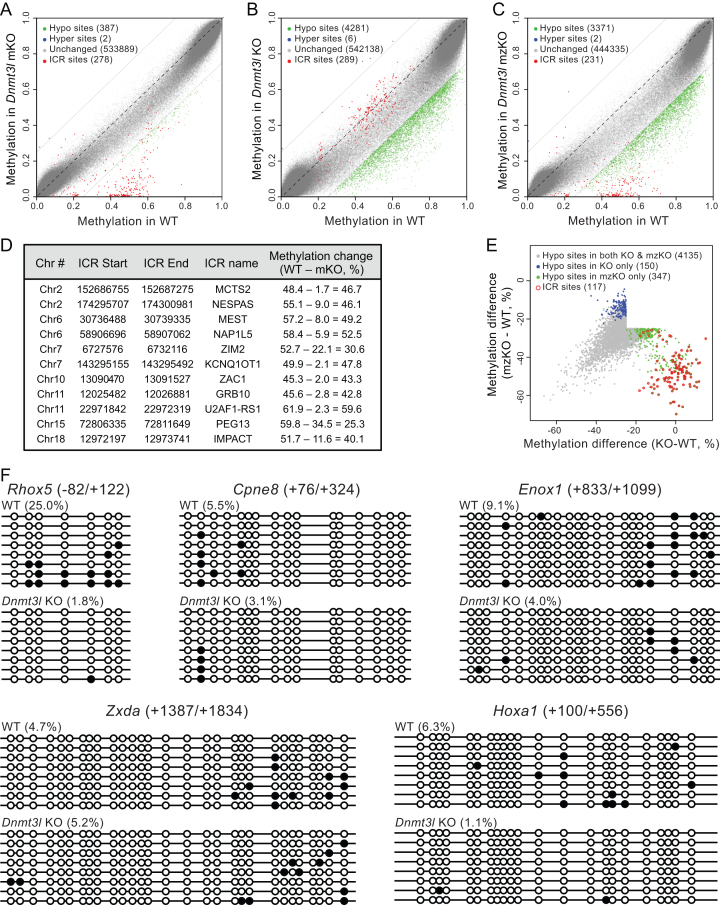
Figure 2.
DNMT3L is a positive regulator of DNA methylation in mESCs. (A–C) Scatter plots of RRBS data in Dnmt3l mKO (A), KO (B) and mzKO (C) mESCs compared to WT mESCs. Each dot represents a CpG site. CpG sites within known ICRs are shown in red. For other CpG sites, significantly (methylation difference ≥25% and q-value ≤ 0.01) hypomethylated ones are shown in green, hypermethylated ones in blue, and those with methylation changes of <25% in gray. (D) ICRs with significantly hypomethylated sites in Dnmt3l mKO mESCs. The start and end locations of the ICRs were from WAMIDEX (http://atlas.genetics.lcl.ac.uk) with minor revisions to the boundaries of the ZAC1 and GRB10 ICRs based on our data. Specifically, two previously annotated ZAC1 ICRs separated by 346 bp were considered a continuous ICR, as 34 of 35 hypomethylated CpGs in Dnmt3l mKO mESCs fell between the regions, and the GRB10 ICR was extended by 549 bp, as 26 of 58 hypomethylated CpGs in Dnmt3l mKO mESCs were 13–549 bp downstream of the end of the previously annotated ICR. (E) Scatter plot of the hypomethylated sites in Dnmt3l KO and mzKO mESCs showing overlap of the vast majority of these sites (gray) with the exception of those in ICRs (red), which were severely hypomethylated in Dnmt3l mzKO cells but showed no change in methylation in Dnmt3l KO cells. The plot was generated using the union of hypomethylated sites at methylation difference ≥25% and q-value ≤0.01 in Dnmt3l mzKO or Dnmt3l KO cells, with sites with q-value ≤0.01 in both genotypes being considered common sites. (F) Bisulfite sequencing analysis of five gene regions that Neri and colleagues showed gain of methylation in Dnmt3l KD mESCs, which revealed loss of or no changes in methylation in Dnmt3l KO mESCs instead. The beginning and end of each amplified region, relative to the transcription start site (TSS), are indicated. Open and filled circles represent unmethylated and methylated CpG sites, respectively. The methylation levels (in percentages) of each region in WT and Dnmt3l KO mESCs are shown.

