Figure 6.
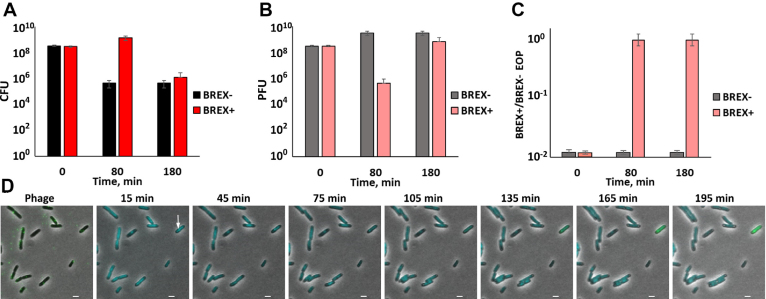
Modified phage appears in the course of infection of BREX+ cells and overcomes protection. (A) The amount of colony forming units (CFU) in BREX+ and BREX- cultures infected at the MOI of 1 and t = 0 is shown 80 and 180 min post-infection. Mean values from three independent experiments are presented with standard deviations shown. (B) The amount of plaque forming units (PFUs) in BREX+ and BREX- cultures from panel (A). Mean values from three independent experiments are presented with standard deviations shown. (С) Efficiency of plaquing (EOP) of phages collected from infected cultures from panel (B) EOP was determined by calculating the ratio of phage titer on BREX+ and BREX- cell lawns. Mean values from three independent experiments are presented with standard deviations shown. (D) Live microscopy observation of BREX+ cells infected (MOI = 1) with phage λ. An arrow shows a productively infected cell. Scale bar, 2 μm.

