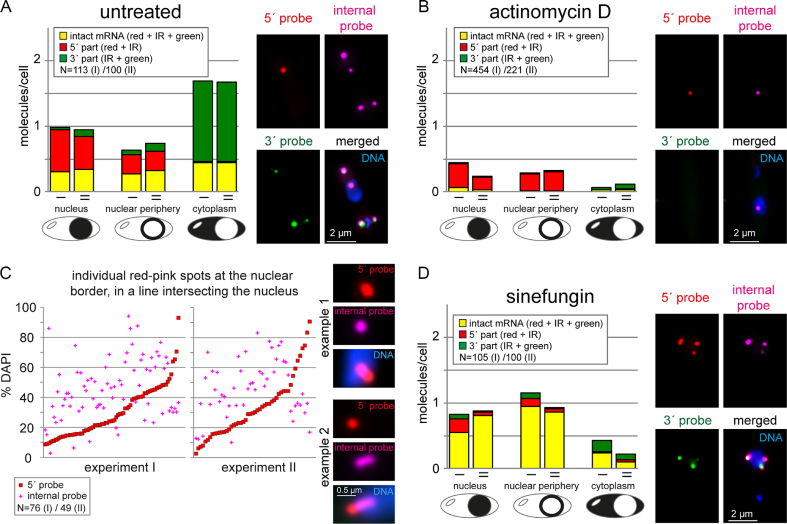
Figure 3.
Nuclear export requires neither completion of transcription, nor of splicing. Three colour intramolecular smFISH of Tb927.1.1740 (compare Fig 2A). Data of two biological replicates (I and II) are shown for all experiments. (A) The distinct mRNA molecules (intact = stained in red, infrared (IR) and green; 5′ part = stained in red and IR; 3′ part = stained in IR and green) were classified according to their localization (nucleus, nuclear periphery, cytoplasm). Any molecule that was localized at the nuclear border and had at least one of its FISH signals between 66.6 and 10% DAPI fluorescence was classified as ‘nuclear periphery’. One example image is shown. (B) Cells were treated with actinomycin D for 60 min and analysed as in A. (C) Cells treated with actinomycin D for 60 min were searched for red-pink spots at the nuclear border that were in a line intersecting with the nucleus. The % DAPI fluorescence was determined for both the red and the pink foci and is plotted for each individual spot. For better visualization, the data were sorted according to the % DAPI fluorescence at the red spot. Pink signals above the red line thus correspond to red-pink foci that have the red signal closer to the cytoplasm than the pink signal and thus have the expected orientation of mRNA export. Two example nuclei used for this quantification are shown. The first is a typical example; the second is a rare example with an elongated mRNA molecule, likely reflecting a transcription site distant to the site of export. (D) Cells were treated with sinefungin for 60 min and analysed as in A.

