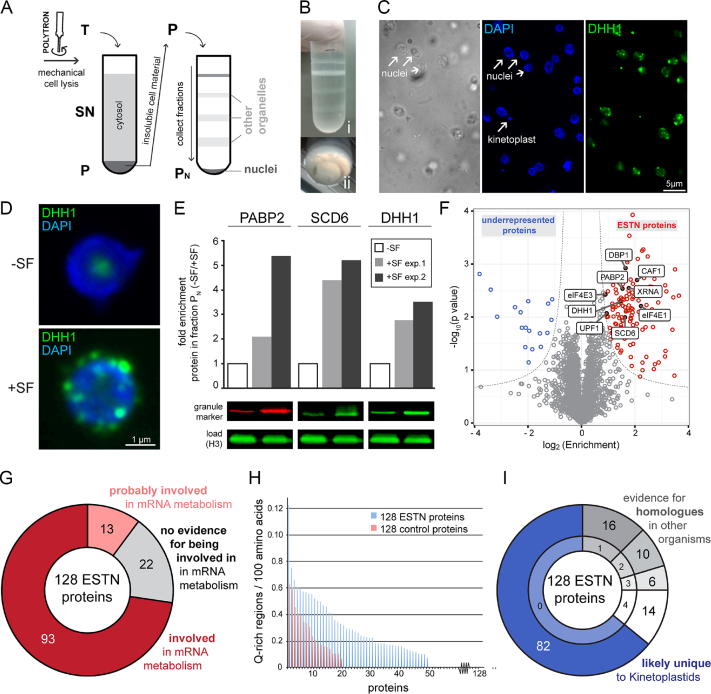
Figure 6.
Purification of nuclei with attached NPGs. (A) Schematics of the procedure. Cells expressing the NPG marker protein eYFP-DHH1 were incubated in the presence and absence of sinefungin (SF) and mechanically lysed with a POLYTRON® mixer. The total cell lysate (T) was separated on a sucrose cushion into a pellet (P) containing crude cell material (nuclei, flagella and kinetoplasts) and a supernatant (SN) containing mostly soluble material from the cytosol. The pellet was resuspended, loaded to a three-step sucrose gradient and further separated by ultracentrifugation into soluble fractions and the pellet fraction PN. (B) Photograph of the three-step sucrose gradient after ultracentrifugation. The different layers of the gradient (i) and the small ring-shaped precipitate at the bottom (Pellet PN) (ii) are shown. (C) Microscopic analysis of Pellet PN of sinefungin treated cells. Isolated nuclei are clearly visible as ovoids and only few other structures are present, such as remnants of flagella (brightfield image). Nuclei are intact (native shape, nucleolus is visible by absence of DAPI staining) and PN contains few kinetoplasts (DAPI image). The presence of NPGs is clearly visible (DHH1). Fluorescence images are shown as deconvolved Z- projections, the phase image is a single plane image. (D) The presence of NPGs is specific to purified nuclei from sinefungin treated cells. Z-projections of representative nuclei isolated from untreated cells (-SF) and sinefungin treated cells (+SF) are shown. (E) NPG marker proteins are enriched in fraction PN of sinefungin-treated cells. The NPG marker proteins PABP2, SCD6 and DHH1 were quantified from fraction PN of control cells (-SF) and NPG-induced cells (+SF) by western blot. For each protein, the fold-enrichment upon sinefungin treatment from two independent experiments is plotted, and one representative western blot is shown. Histone H3 (H3) served as a loading control. (F) Volcano plot of the mass spectrometry data. ESTN proteins are shown in red, proteins that were underrepresented in nuclei of sinefungin treated cells are shown in blue and proteins with no enrichment are shown in grey. The nine previously known NPG proteins are labelled. (G) Most ESTN proteins are involved in mRNA metabolism. Proteins were classified as involved in mRNA metabolism, when they either had a known function in mRNA metabolism (shown experimentally or by being a homologue to a protein with a known function in mRNA metabolism), or possessed RNA-binding domains. Proteins were also classified as involved, when two independent lines of literature evidence support a function in mRNA metabolism. Proteins were classified as ‘probably involved’ in mRNA metabolism, if evidence was based on only one such literature evidence. More details are in Supplementary Table S1A. (H) Enrichment of Q-rich regions in the ESTN proteins. The number of Q-rich regions per 100 amino acids is shown for the 128 ESTN proteins and for a randomly chosen group of control proteins. Q-rich regions were quantified from NPG proteins and a randomly chosen group of control proteins based on the method described in (70,71). Briefly, amino acid sequences of all proteins were divided in 60-mers and a 60-mer was defined as Q-rich region, if it contained at least seven glutamate residues. For each protein, the number of Q-rich regions normalized to the length of the protein (Q-rich regions / 100 amino acids) is blotted; for a better visualization, the proteins were sorted according to their enrichment in Q-rich regions. The control proteins were proteins encoded by adjacent genes on chromosome 1 ranging from Tb427.01.100 to Tb427.01.3280. (I) Most ESTN proteins are unique to Kinetoplastids. All ESTN proteins were screened for putative homologues in Saccharomyces cerevisiae (taxid4932), Caenorhabditis elegans (taxid6239), Mus musculus (taxid10090) and Plasmodium falciparum (taxid5833) by BLAST (default parameters). The top hit of the BLAST analysis was then used for a reverse BLAST against the T. brucei genome. If the original protein was the top hit in the reciprocal BLAST approach and had an e-value of <1 × 10⁻⁵, the protein was classified as having a homologue in the respective organism. With these definitions, the majority of proteins were unique to T. brucei (blue). The remaining proteins had putative homologues in either one, two, three or four of the four organisms (grey). The complete dataset is shown in Supplementary Table S1D.

