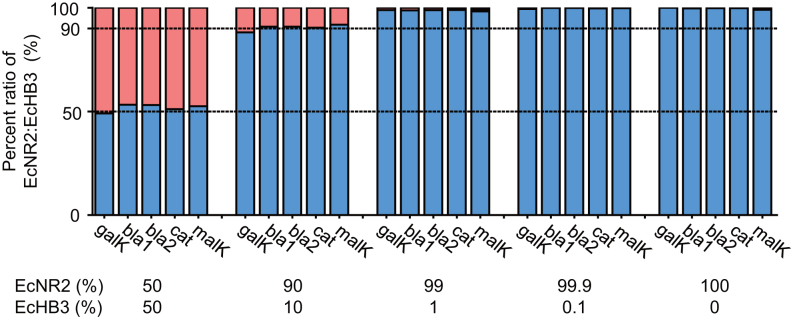
Figure 3.
CRISPR-Cap shows no significant allelic bias. E. coli EcHB3 has five different point mutations compared with E. coli EcNR2. We performed CRISPR-Cap after mixing EcNR2 and EcHB3 genomic DNA in five different ratios (EcNR2:EcHB3 = 50:50, 90:10, 99:1, 99.9:0.1, and 100:0). All five mutations were enriched with CRISPR-Cap, and the ratio of EcNR2 to EcHB3 codons from the sequencing data showed no significant allelic bias (r2= 0.99). Blue bars represent the percentage of the EcNR2 allele, and red bars represent the percentage of the EcHB3 allele (see also Supplementary Figure S9 for the enlarged plot of values at 99:1, 99.9:0.1 and 100:0).

