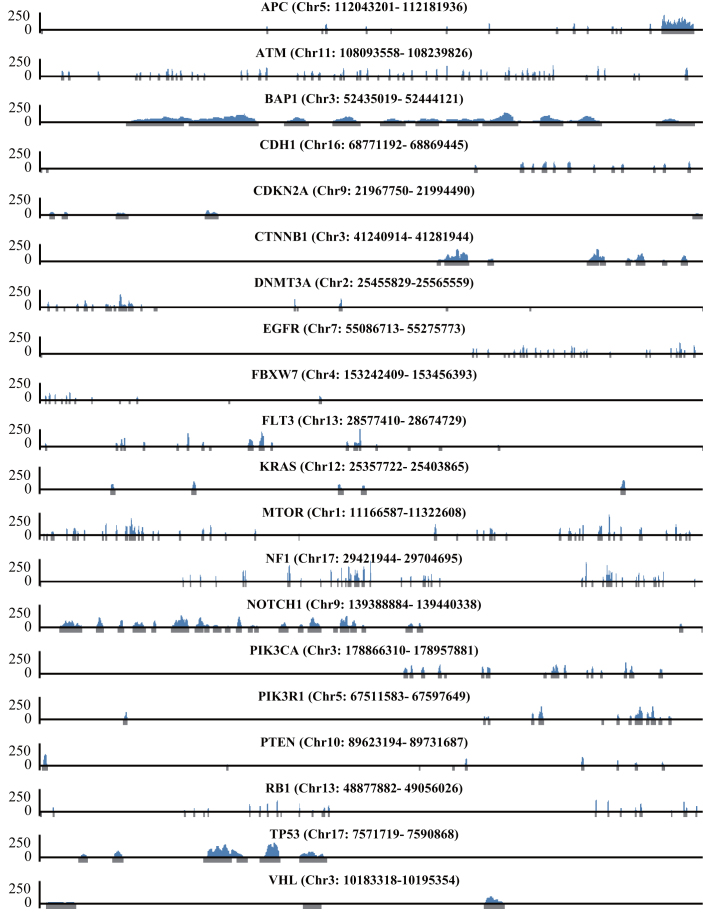
Figure 5.
Enrichment of CDS regions in human genomic DNA by CRISPR-Cap. The enrichment results of NA12878 genomic DNA using CRISPR-Cap (1:10,000_5 from Supplementary Table S10). Gray regions under the x-axis indicate target regions, which include all exons of 20 genes and additional 100-bp upstream and downstream of each exon. The x-axis is the genomic position, and the y-axis is the sequencing reads count.

