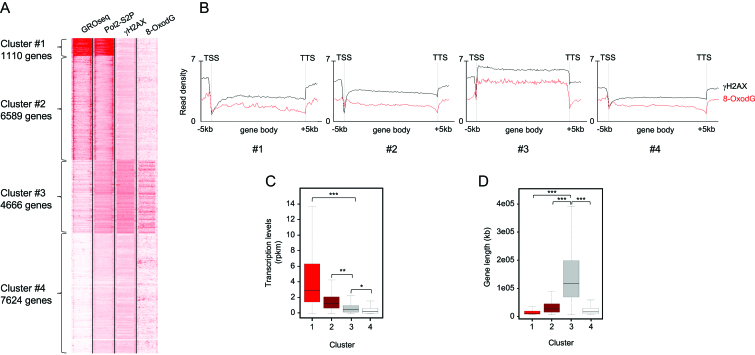
Figure 3.
(A) Heatmap showing GRO-Seq, Pol2-S2P, γH2AX ChIP-Seq, and 8-oxodG OxiDIP-Seq signals at the gene body, and within the 5 kb both upstream the TSS and downstream the TTS of the RefSeq genes. Gene clusters identified by SeqMINER unbiased k-means clustering (Cluster #1–#4), and the number of genes contained within each cluster, as indicated. (B) Read density profiles of 8-oxodG OxiDIP-Seq (red) and γH2AX ChIP-Seq (black) in Cluster #1–#4, as indicated. (C) Box plot showing the distribution of transcription levels (RPKM, measured by GRO-seq) of human genes within each cluster in MCF10A cells. (D) Box plot showing the length distribution of human genes within each cluster in MCF10A cells (P< 2.2e–16, ANOVA test; ***P< 2.2e–16, **P = 2.1e–3, *P = 2.4e–2, Bonferroni post hoc analysis for pairwise comparison).

