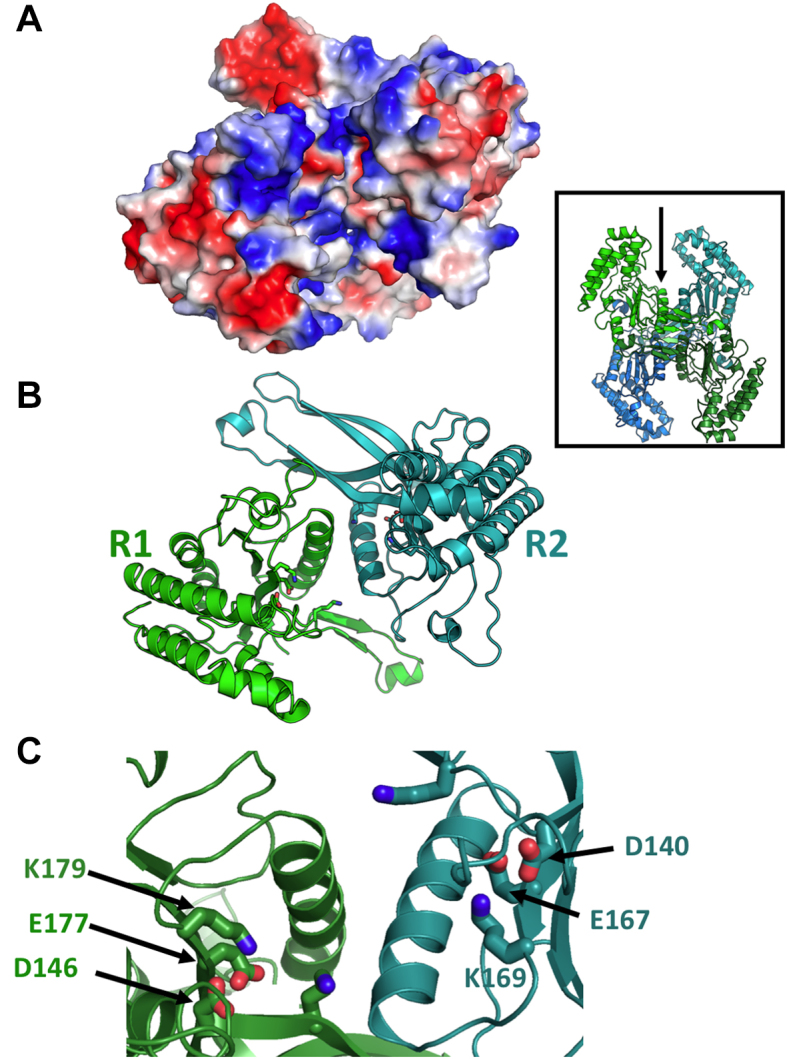
Figure 4.

Proposed DNA-binding cleft and active site arrangement of an R1:R2 assemblage within the BbvCI heterotetrameric structure. Panel A (an electrostatic surface charge representation) and Panel B(ribbon diagrams) are shown in the same orientation, looking into the subunit interface and cleft (also illustrated with the arrow in the inset). The walls of the cleft are highly basic (blue color, representing overall positive charge) except for the two acidic residues of each catalytic site (red color, representing negative charge). Panel Cdisplays a magnified image of the bottom of the protein interface and cleft, with the catalytic residues from each subunit labeled.
