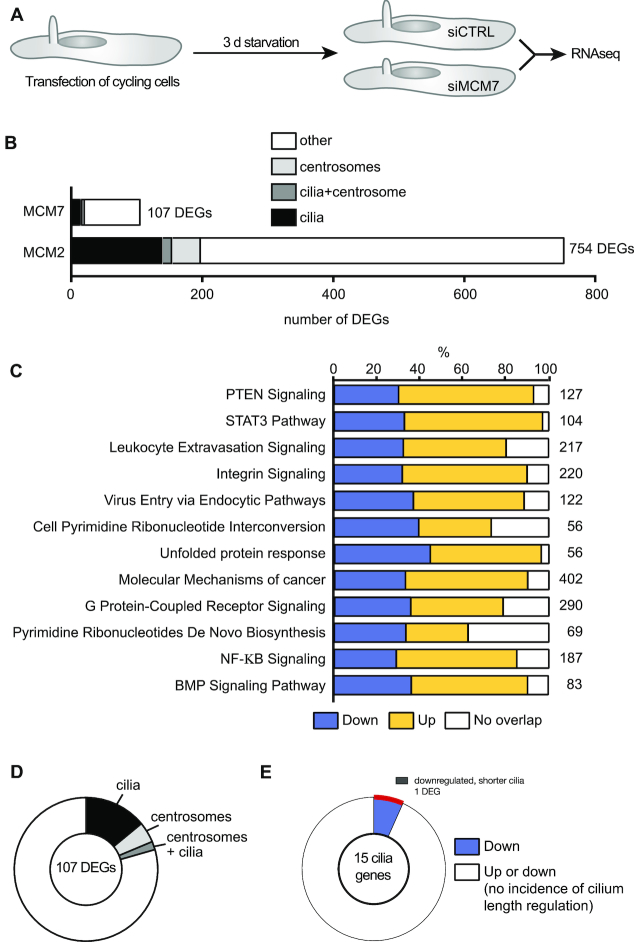
Figure 11.
Knockdown of MCM7 in human fibroblasts does not mimic transcriptional changes upon MCM2 knockdown. (A) Cycling hTert fibroblasts were transfected with siRNAs and ciliation was induced by serum starvation. Afterwards RNAseq was performed. n = 3. (B) Bar graph displaying the number of DEGs upon MCM7 knockdown versus MCM2 knockdown in human fibroblasts. DEGs were classified as linked to cilia or centrosomes as described in the methods section. (C) Pathways changed upon MCM7 knockdown (cut off: ≥1.5-fold up or down). (D) Pie chart showing the percentage of DEGs associated with cilia, centrosomes or both structures according to literature. Only genes with ≥1.5-fold regulation and P < 0.05 were considered. (E) Only 1 of the 15 DEGs linked to cilia has been reported to alter cilium length (shorter cilia upon knockdown).

