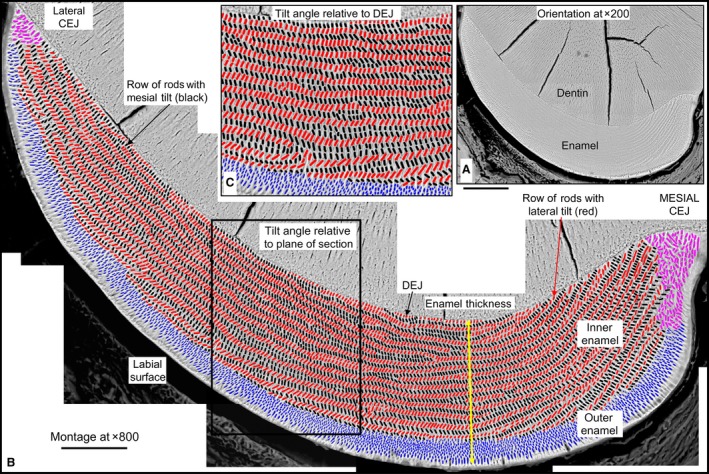
Figure 1.

Orientation to the enamel layer and method employed for quantifying enamel rods in cross‐section. Illustration of approach employed for making high magnification maps of the labial side of mandibular mouse incisors from montaged BEI images and for color‐coding enamel rod profiles by their regional distribution within the enamel layer: inner enamel layer with rod profiles having a mesial (black) or lateral (red) tilt, outer enamel layer with rod profiles appearing diamond‐shaped (blue), and irregular rod profiles located near the lateral and mesial cementoenamel junctions (CEJ) (magenta). (A) Low magnification BEI image (×200) of labial side of the mandibular mouse incisor showing location of enamel and dentin in a typical cross‐section of the tooth. The cracks in the dentin are an artifact caused by air drying the tissue slice. (B) A high‐resolution map of the same tooth section shown in (A) made from BEI images photographed at ×800 and montaged together to recreate the whole enamel layer. The site for measuring enamel thickness and regional subdivisions of the enamel layer are indicated. (C) Some quantitative measurements of rod profile tilt angles were made by cropping out areas so their edges were oriented parallel to the DEJ rather than within the plane of the cross‐section (box in B). Scale bars: (A) 100 μm, (B) 50 μm.
