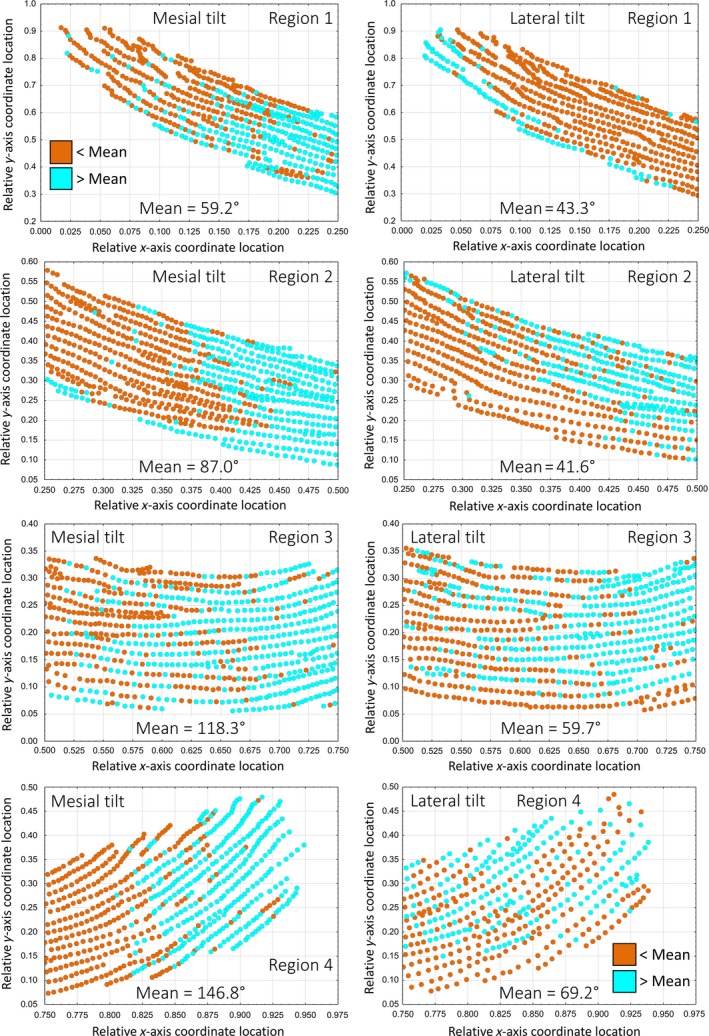
Figure 3.

Scatterplots of tilt angle of rod profiles across rows and depth of the inner enamel layer in the lateral (1), mid lateral (2), central labial (3), and mesial (4) regions of the inner enamel layer on a single incisor. Graphs from a single mouse mandibular incisor showing the distribution of rod profile angles for rows having a mesial tilt (left side) or lateral tilt (right side) relative to the mean circular angle (less than, brown; greater than, cyan) computed on a regional basis (lateral, region 1; mid lateral, region 2, central labial, region 3; mesial, region 4). Rod profile angles across different rows or across the thickness of the enamel layer are very variable and show no clear pattern, and less so for rows having a lateral tilt compared with those having a mesial tilt, where changes in the mean circular angle occur more dramatically between regions. The central labial region (3) is the only part of the enamel layer showing some similarities in the distributions of rod profile angles relative to the mean for the two rod tilt categories. In the mesial region (4), rod profiles having a lateral tilt are more widely spaced apart from one another compared with the other regions.
