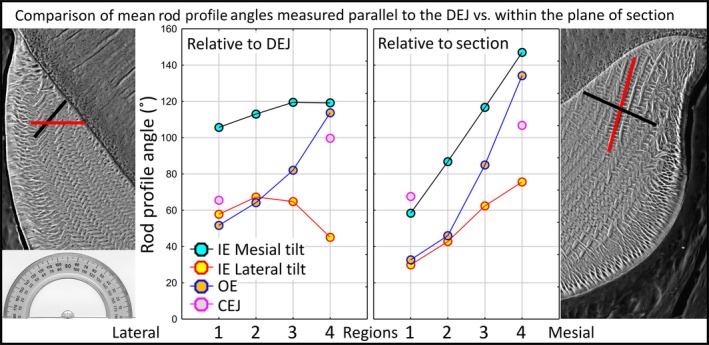
Figure 7.

Graphs summarizing rod profile angle relationships across the four regions of the enamel layer as measured relative to the plane of section or to the DEJ. Graphs summarizing rod profile angle relationships across the four regions of the enamel layer (1, lateral; 2, mid lateral, 3, central labial; 4, mesial) within the inner enamel layer (IE), the outer enamel layer (OE) and near the CEJ as measured either within the plane of section (transverse) or relative to cropping box positioned parallel to the DEJ. At the left and right sides of the graphs are BEI images of the lateral and mesial regions (1 and 4) with example rod profiles having a mesial (black) or lateral (red) tilt for orientation purposes. At the left side an image of a protractor is included for reference. Data are from the right and left mandibular incisors of six mice (12 incisors total). Number of rods analyzed, n = 50 000 relative to the DEJ and n = 92 500 relative to plane of section. Angulation differences from lateral to mesial sides of a cross‐section are much less pronounced for rod profiles forming the inner enamel layer when imaging fields are aligned parallel to the DEJ prior to measurement. Angulation differences are relatively unchanged for rod profiles forming the outer enamel layer and those located near the CEJs irrespective of alignment method.
