Figure 2.

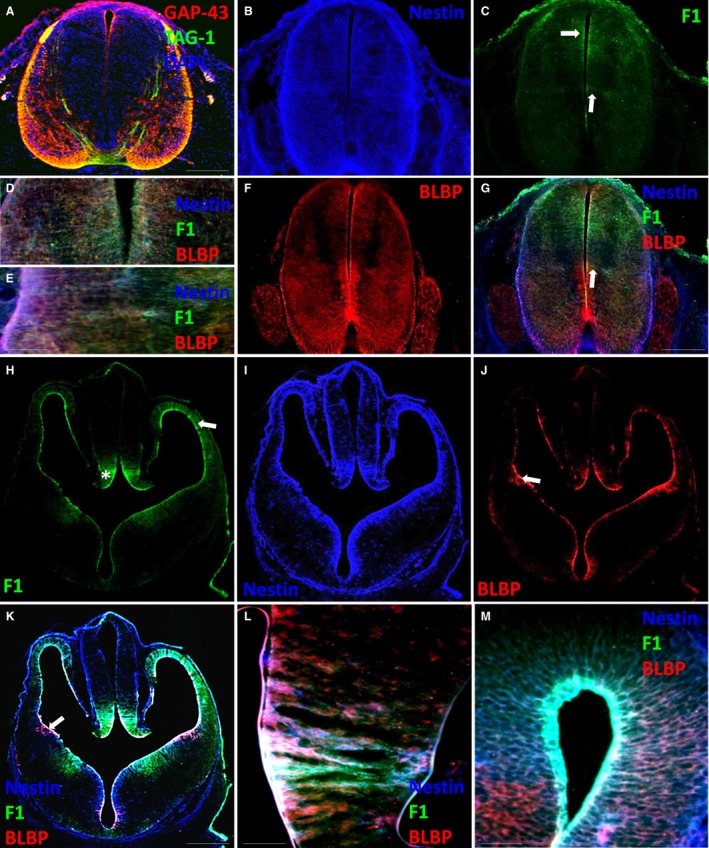
Spinal cord and forebrain at E13. (A) GAP‐43, TAG‐1 and DAPI expression in the spinal cord. (B,C) Nestin and FORSE‐1 expression in the spinal cord. (D,E) Higher magnification images showing nestin, FORSE‐1 and BLBP expression in the dorsal and lateral spinal cord. (F) BLBP expression in the spinal cord. (G) Merged image of the spinal cord showing nestin, BLBP and FORSE‐1 expression. (H‐J) FORSE‐1, nestin and BLBP expression in the forebrain. (K) Merged image showing nestin, BLBP and FORSE‐1 expression. (L,M) Higher magnification images showing nestin, BLBP and FORSE‐1 expression in the medial ganglionic eminence and dorsal cortex. Scale bar: (A,G) 200 μm; (K) 400 μm; (D,E,L,M) 50 μm.
