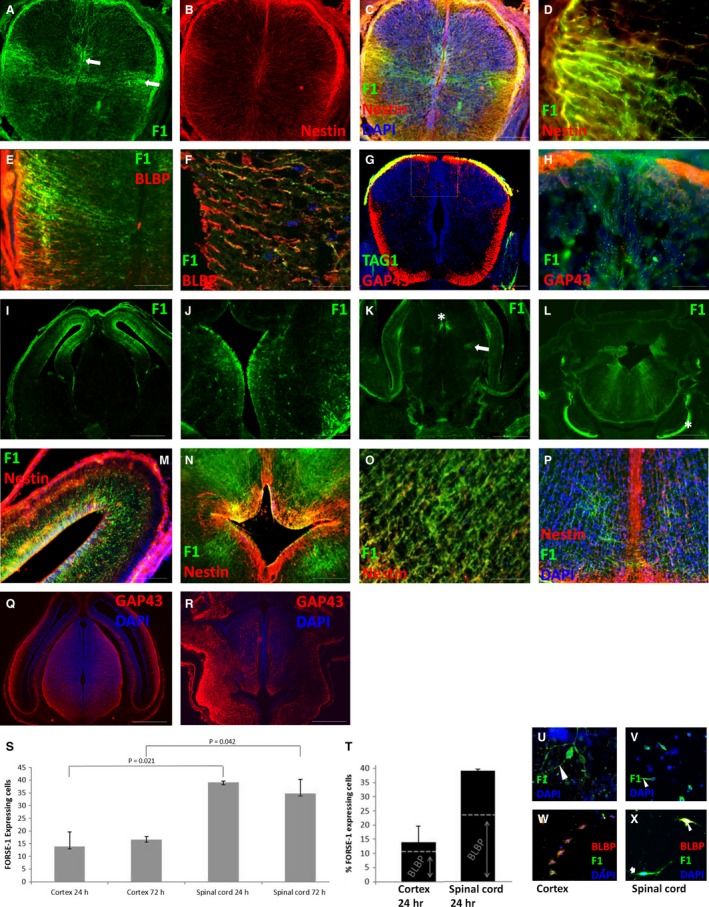
Figure 3.

Spinal cord and brain at E15. (A,B) FORSE‐1 and nestin expression in the spinal cord. (C) Merged image showing FORSE‐1, nestin and DAPI expression. (D) FORSE‐1 and nestin co‐localisation in the lateral spinal cord. (E,F) BLBP and FORSE‐1 co‐localisation in the lateral spinal cord. (G) TAG‐1‐ and GAP43‐expressing axon tracts in the spinal cord. (H) Confocal micrograph showing FORSE‐1 and GAP43 expression in the dorsomedial spinal cord. (I‐L) FORSE‐1 expression in the forebrain, diencephalon and hindbrain. (M) Nestin and FORSE‐1 expression in the cortex. (N,O) FORSE‐1 and nestin expression around the 4th ventricle and in the midbrain. (P) FORSE‐1, nestin and DAPI expression in the midbrain. (Q,R) GAP‐43‐expressing axons in the forebrain and brainstem. (S) Percentage of FORSE‐1‐expressing cells isolated from the cortex and spinal cord at 24 and 72 h in vitro. (T) BLBP expression in FORSE‐1‐expressing cells isolated from the cortex and spinal cord at 24 h. (U‐X) FORSE‐1 and BLBP immunocytochemistry in the cortex and spinal cord. Scale bar: (C,G) 200 μm; (D‐F,M) 100 μm; (H,J,N‐P) 50 μm; (I,K,L,Q,R) 400 μm.
