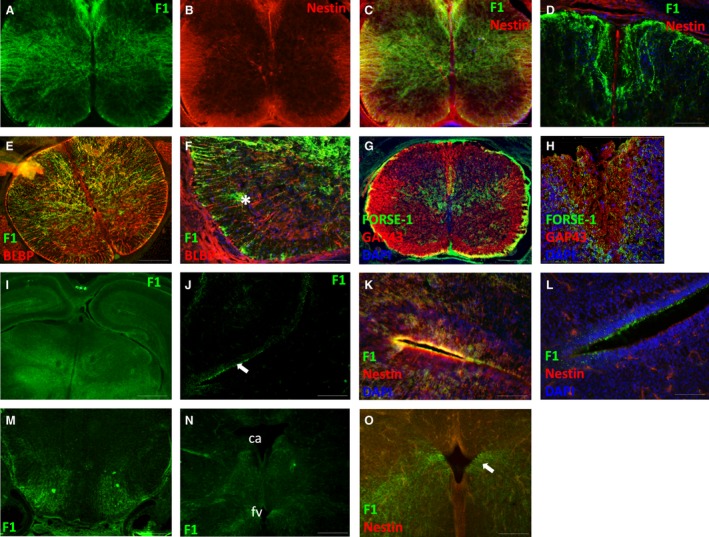
Figure 4.

Spinal cord and brain at E17. (A‐C) FORSE‐1 and nestin expression in the spinal cord. (D) FORSE‐1 and nestin expression in the dorsal spinal cord. (E,F) BLBP and FORSE‐1 expression in the spinal cord. (G,H) GAP‐43 and FORSE‐1 expression in the spinal cord and in the emerging dorsal columns. (I) FORSE‐1 expression in the forebrain. (J) FORSE‐1 expression at inferior surface of the lateral ventricle ventricular zone. (K,L) Higher magnification view of the superior and inferior cortex showing nestin, FORSE‐1 and DAPI localisation. (M,N) FORSE‐1 expression in the emerging brainstem. (O) Nestin and FORSE‐1 expression in the region of the fourth ventricle. Ca, cerebral aqueduct; fv, fourth ventricle. Scale bar: (C,E,G,J,M) 200 μm; (D,F,O) 100 μm; (H,K,L) 50 μm; (I) 500 μm.
