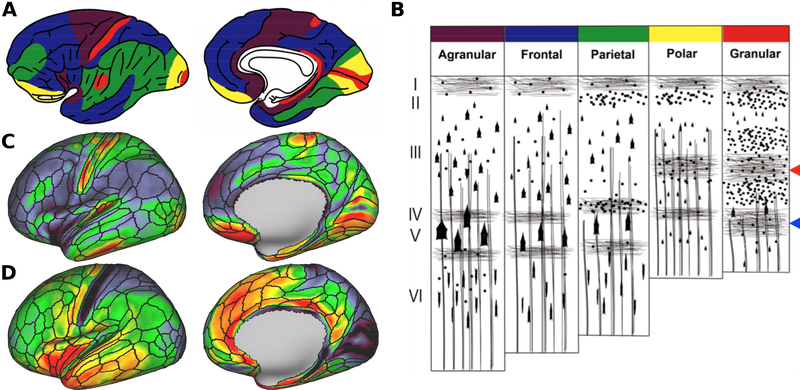
Figure 5.
Comparison between von Economo – Koskinas atlas (von Economo and Koskinas, 1925) and neurite orientation dispersion and density imaging (NODDI). (A) Cortical distribution of von Economo’s five main cytoarchitectonic types. Color codes are deciphered in the (B) cytoarchitecture type scheme superimposed with tangential and radial myelinated axons. (Braak, 1980; Nieuwenhuys, 2013; Triarhou, 2009; von Economo and Koskinas., 1925). The outer and inner stripes of Baillarger are indicated by the red and blue arrowheads, respectively. (C) Orientation dispersion index (ODI) map exhibits relative high values in granular and polar cortices. (D) Cortical thickness map shows relatively low values in granular and polar cortices. Data at https://balsa.wustl.edu/vpmD

