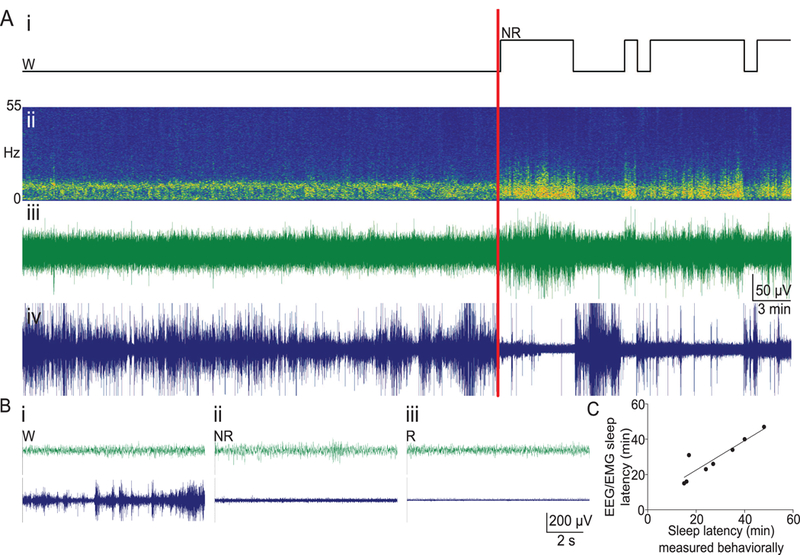
Figure 1. EEG validation of behavioral scoring of sleep-onset latency.

A) Representative EEG/EMG data from one mouse. (i) Hypnogram of a 60 min segment of a mouse with video and EEG/EMG scoring. Wake (W) and non-REM sleep (NR) are shown, with a red vertical line indicating the time of the independently-scored behavioral onset of sleep from the video. (ii) Fast-Fourier-based spectrogram shows predominantly theta activity during wakefulness and an increased in low-frequency EEG power at the onset of sleep, correlating with changes in (iii) EEG and (iv) EMG. B) Example traces with a 30 sec time-base showing EEG and EMG activity during (i) wakefulness, (ii) non-REM sleep, and (iii) REM sleep. C) There is a significant correlation between EEG/EMG and behavioral/video scoring of sleep onset (n = 8, r = 0.9058, p = 0.0019). One outlier resulted from using 20 sec epochs for EEG/EMG scoring and a 2-min requirement for sleep onset for video scoring. Voltage/time scales in (A) and (B) apply to both EEG and EMG traces.
