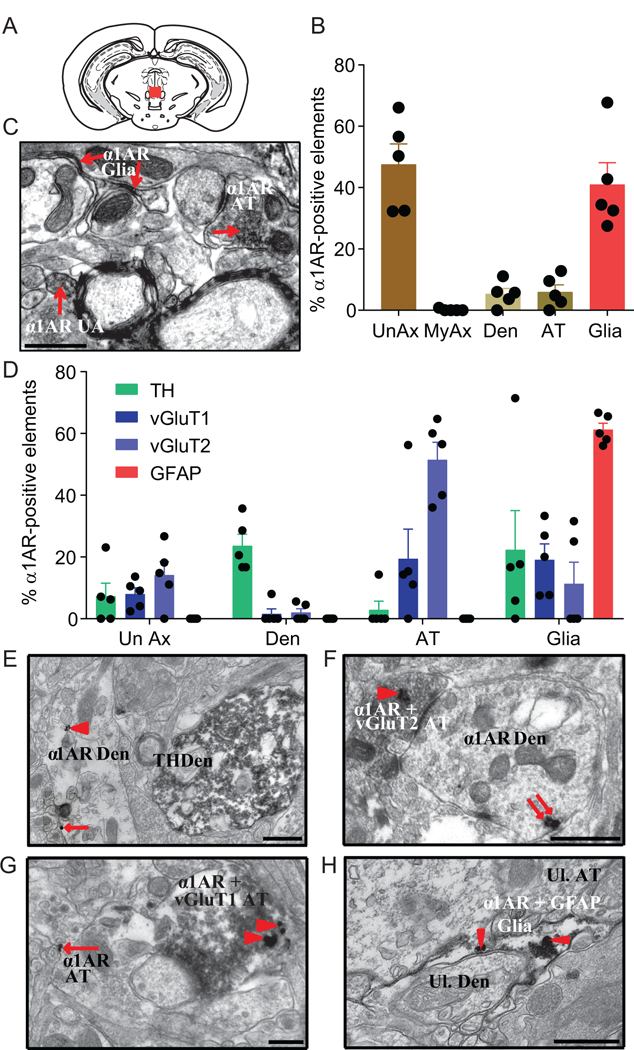
Figure 6. Anatomical location of vPAG α1ARs determined with immunoelectron microscopy.

A) Red box signifies the portion of the vPAG used for EM experiments. B) Histogram depicting the mean percentage (±SEM) of unmyelinated axons (UnAx), myelinated axons (MyAx), dendrites (Den), axon terminals (AT), and glia found within the vPAG that contained immunoperoxidase labeling for the α1AR. C) Representative electron micrograph with immunoperoxidase labeling (arrows) for the α1AR in an unmyelinated axon (UnAx), axon terminal (AT), glial element. D) Percentage of α1AR-labeled elements co-labeled with TH, vGluT1, vGluT2, or GFAP. E) Representative micrograph of an α1AR-labeled dendrite (Den) with immunogold (arrowheads point to intracellular gold particles; arrows point to plasma membrane bound gold particles) and a TH-positive dendrite filled with immunoperoxidase labeling. F) Representative micrograph of a double-labeled AT with intracellular gold particles for the α1AR and immunoperoxidase for vGluT2 synapsing on a α1AR labeled dendrite. G) Representative micrograph of a double-labeled axon terminal (AT) for the α1AR in immunogold and vGluT1 with immunoperoxidase synapsing on an unlabeled dendritic process. In addition, pictured is an α1AR-labeled AT with plasma membrane bound gold particles. H) Representative micrograph of a double-labeled astrocyte, containing GFAP with immunoperoxidase (patchy dark gray/black area within astrocyte) and intracellular α1ARs in immunogold (arrowheads point to α1ARs), wrapping around an unlabeled dendrite (Ul. Den). All scale bars = 0.5 μm.
