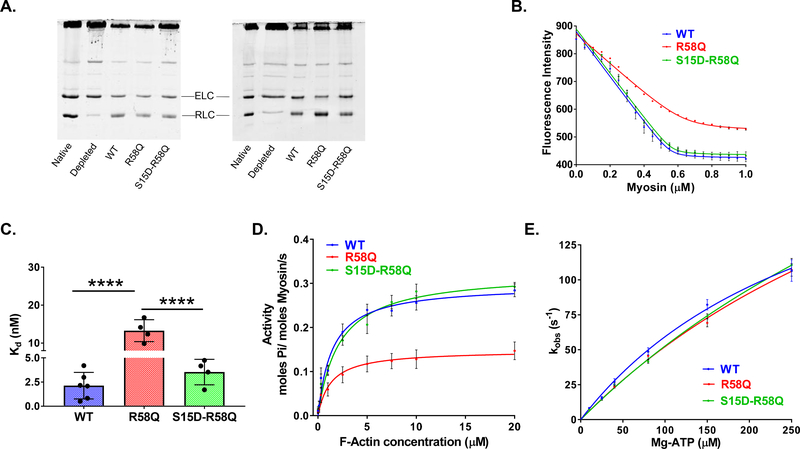
Figure 2. Biochemical assays on RLC-depleted/reconstituted porcine cardiac myosin.
A. Representative SDS-PAGE of CDTA/Triton depleted and RLC reconstituted myosin. Two different batches of depleted and reconstituted porcine myosin are presented. B. Fluorescence-based binding of WT, R58Q and S15D-R58Q -reconstituted myosin to pyrene labeled F-actin. Actin at a concentration of 0.5 μM was titrated with increasing concentrations of reconstituted myosin (0.05–1.0 μM) under rigor (no ATP) conditions. Quenching of pyrene fluorescence on actin-myosin binding was recorded and the data fitted with a non-linear binding equation (see Methods). 4–6 independent titrations per group were performed. C. Plots of dissociation constants (Kd) for RLC-reconstituted myosins. Data from B. were plotted as bar graphs. Note the significantly higher Kd (lower affinity) for R58Q mutation, which is offset in the presence of S15D phosphomimic. ****p<0.0001 versus WT, S15D-R58Q for n = 4–6, by one-way ANOVA with Tukey’s multiple comparison test. D. Actin-activated myosin ATPase activity. Reconstituted myosins (at concentration of 1.1 μM) were incubated with increasing concentrations of actin (0.1–20 μM) and assayed for actin-activated myosin ATPase activity. The reactions were initiated with the addition of 2.5 mM ATP. Note that a significantly lower Vmax observed for R58Q mutation was rescued in the presence of the phosphomimic S15D-R58Q. Data are the average ± SEM of n = 12–17 independent experiments; ****p<0.0001 versus WT, S15D-R58Q; by one-way ANOVA with Tukey’s multiple comparison test. No significant differences in Km were observed among the groups. E. Stopped-flow measurements of actomyosin dissociation. Fast kinetic interactions between porcine myosin reconstituted with recombinant RLC proteins (WT, R58Q and S15D-R58Q) and pyrene-labeled F-actin. Dissociation rates (kobs) were plotted as a function of [Mg-ATP] = from 10–250 μM. The values of kobs ± SEM for each Mg-ATP concentration are presented in Table 4. No significant differences were found between the overall fits among the RLCs (Extra sum-of-squares F-test, p>0.05).

