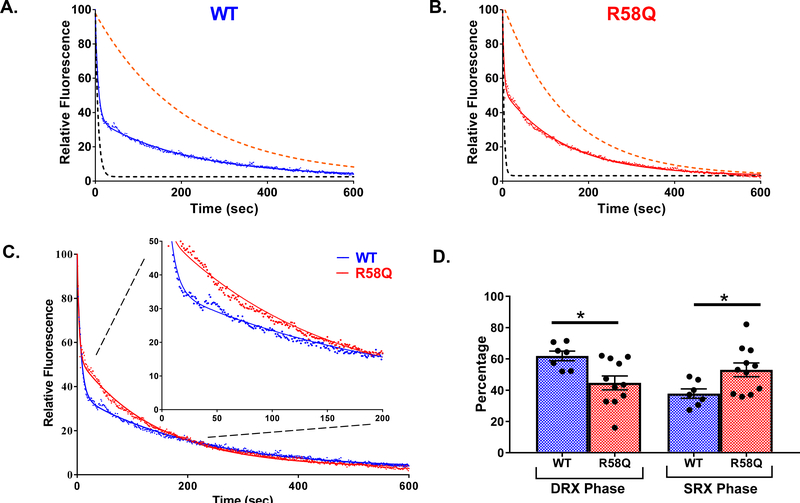
Figure 5. Single nucleotide turnover studies in PM fibers from transgenic WT versus R58Q mice.
Fluorescence decays of mant-ATP release in transgenic WT (blue trace, A) and R58Q (red trace, B). The fiber was first incubated in 250 μM mant-ATP and subsequently chased with a solution containing 4 mM ATP. Decay traces were fitted to a double-exponential equation, yielding DRX and SRX rates. Simulated single-exponential dashed curves represent DRX (black) and SRX (orange) phases for WT and R58Q fiber. C. Overlay of WT and R58Q decay traces fitted to double-exponential equation with inset plots. D. Percentages of myosin heads in the DRX (P1) versus SRX (P2) states. R58Q fibers showed a significantly increased P2 population compared to WT. Data are the average ± SEM of n = 7–11 fibers. *p<0.05 versus WT; by student’s t-test.

