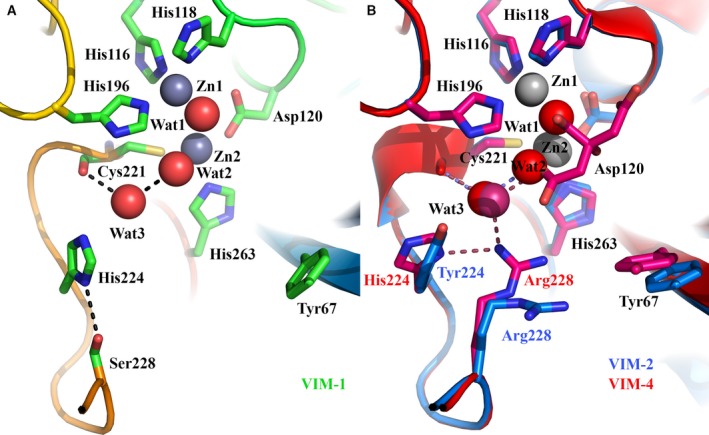
Figure 2.

Comparison of VIM active sites. (A) Active site of VIM‐1, showing positions of His224 and Ser228 and location of Cys221‐bound water Wat3. Hydrogen bonding interactions are shown as dashed lines. (B) Active site superpositions of VIM‐2 (pdb 4BZ3, blue) and VIM‐4 (pdb 2WHG, red) showing variations at positions 224 and 228.
