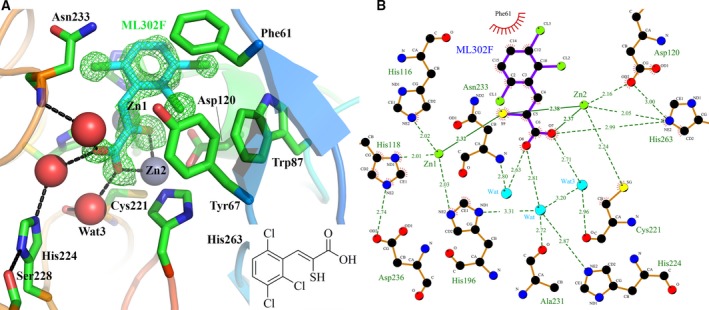
Figure 3.

Interactions of thioenolate inhibitor ML302F with VIM‐1. (A) Structure of ML302F:VIM‐1 Complex. VIM‐1 main chain Cα atoms are colour ramped from blue (N terminus) to red (C terminus). Active site residues are rendered as sticks; zinc ions as grey spheres, water molecules as red spheres. Inhibitor carbon atoms are in cyan, side chain carbons in green. Other atom colours are as standard. Electron density shown is |F o| − |F c| Φcalc contoured at 3 σ around inhibitor and calculated with the ligand omitted. Hydrogen bonding interactions are shown as dashed lines. Inset shows structure of ML302F. (B) Map of VIM‐1–ML302F interactions. Zinc ions are rendered in green; water molecules in cyan; other atom colours as standard. The figure was generated using ligplot 59.
