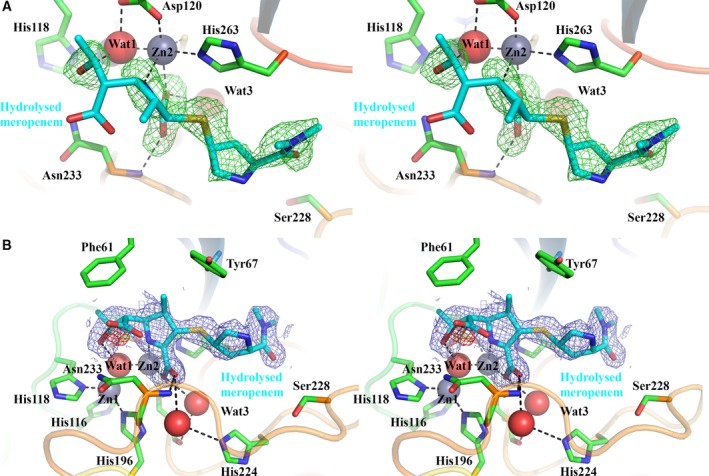
Figure 4.

Electron density maps for hydrolysed meropenem bound to VIM‐1. (A) Stereoview of |F o| − |F c| Φcalc electron density (green; calculated with ligand omitted) contoured at 2.5 σ around hydrolysed meropenem (cyan). Note the position of the S atom out of the plane of the pyrroline ring. (B) Stereoview of 2|F o| − |F c| Φcalc electron density (blue) and |F o| − |F c| Φcalc electron density (negative peak red; both calculated with ligand included) contoured at 1.0 and 3.0 σ respectively, around hydrolysed meropenem (cyan). Note the presence of only very limited negative density close to the C7 carboxylate. Active site residues are rendered as sticks; zinc ions as grey spheres, water molecules as red spheres. Other atom colours are as standard.
