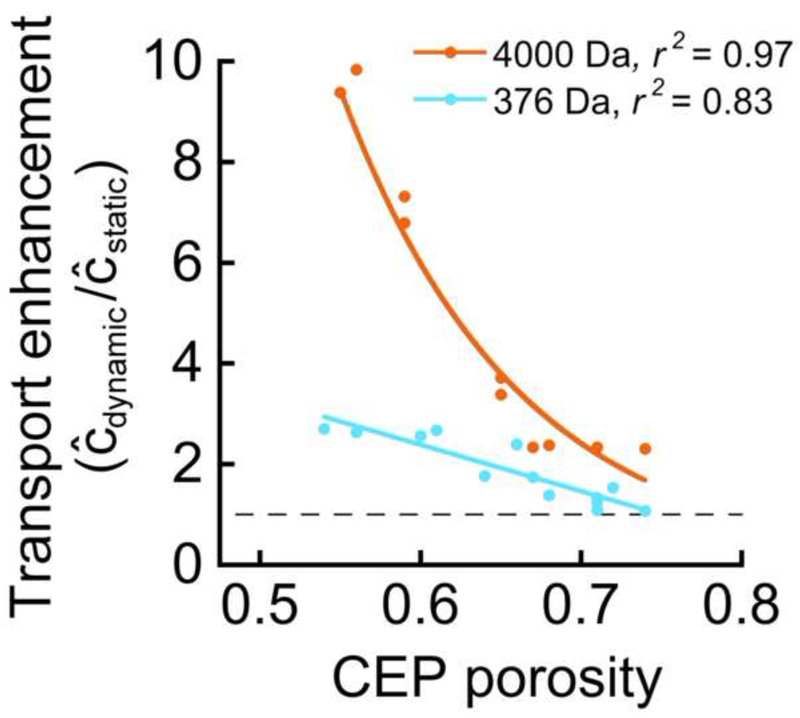
Figure 3.
Transport enhancement correlated significantly with CEP porosity for tests using the 376 Da solute (p < 0.0001) and the 4,000 Da solute (p < 0.0001). The dashed line at y = 1 represents equivalent solute transport under static and dynamic loading conditions. Solute transport enhancement (Ĉdynamic/Ĉstatic) from dynamic loading was calculated at the end of the 80-minute loading period. The linear equation used to fit the 376 Da data is y = −9.2x + 7.9. An exponential curve was used to fit the 4,000 Da data because the slope of the relationship significantly decreases in magnitude at porosities above 0.65. The equation of the exponential curve shown is y = 2450*e−9.995x.

