
Figure 2.
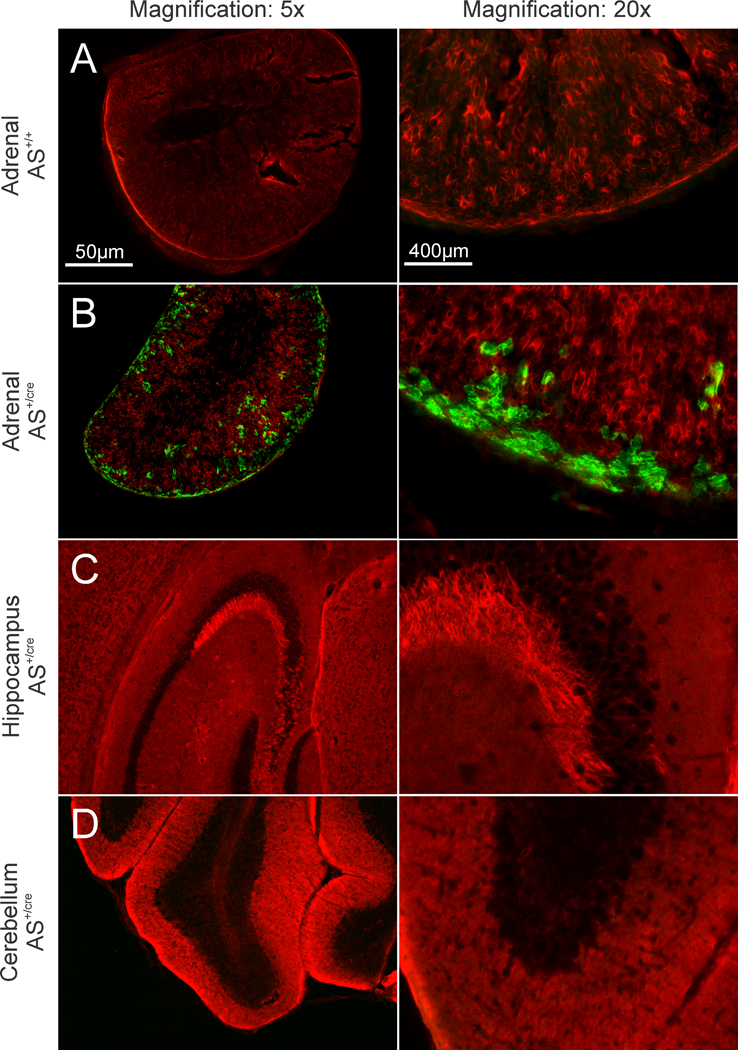
Visualization of GFP (green) and tdTomato (red) in R26R+/ mTmG mice, amplified by immunostaining (anti-GFP and anti-DsRed). Wide-field images of 40µm tissue slices from control mice (AS+/+, A) and mice expressing Cre-recombinase in aldosterone synthase expressing cells (AS+/Cre, B-D). Green fluorescence demonstrates Cre expression in the zG layer (B) but not in the hippocampus (C) nor cerebellum (D) of AS+/Cre mice. Images were captured at 5x (left column; scale bar = 50µm) or 20x magnification (right column; scale bar = 400µm).