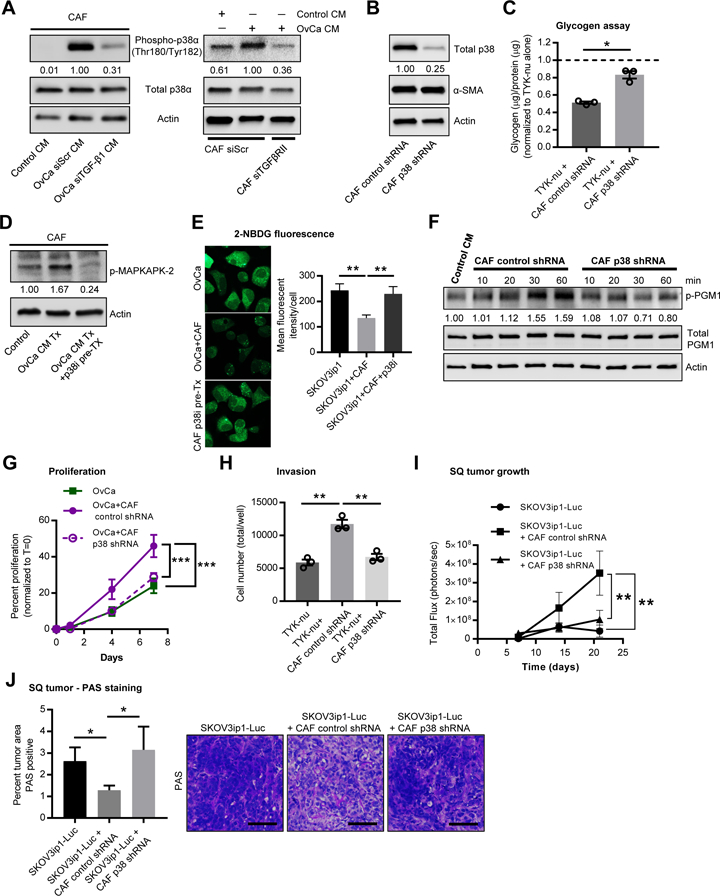
Figure 5. Glycogen utilization is dependent on p38α MAPK activity in cancer associated fibroblasts.

(A) Western blot for p38α phosphorylation in CAFs. Left, CAFs treated with conditioned media (CM) from SKOV3ip1 cells transfected with either TGF-β1 or scrambled (siScr) siRNA. Right, CAFs transfected with either TGF-βRII or scrambled (siScr) siRNA were stimulated with control or SKOV3ip1 CM for 4 hr. Values represent relative band intensity of p-p38 expression normalized to total p38 and fold change relative to the OvCa stimulated sample. Images are representative of three biological repeats. (B) Validation of p38 knockdown in primary CAFs. α-SMA (smooth muscle actin) is unchanged with p38 knockdown. Values represent relative band intensity of total p38 expression normalized to actin and fold change relative to the control shRNA sample. Images are representative of three biological repeats with primary CAFs from three patients. (C) Glycogen assay on TYK-nu cells stimulated with CM collected from CAFs expressing a control shRNA or a p38α shRNA. Values are normalized to TYK-nu alone shown by the dotted line and represent 3 biological repeats. Values are mean + SEM (*p< 0.05). (D) Western blot for phospho-MAPKAPK-2, a downstream effector of the p38 MAPK pathway, in CAFs treated with and without PH-797804, a p38α MAPK inhibitor. Values represent relative band intensity of p-p38 normalized to actin. (E) Glycogen storage (left) was visualized by 2-NBDG fluorescence in SKOV3ip1 cancer cells after 4 hr of co-culture with CAFs. CAFs were pretreated with 2 µM of PH-797804 for 1 hr prior to co-culture. Right, quantification of 2-NBDG fluorescence. (F) Western blot for p-PGM1 at Y353, total PGM1 and actin in TYK-nu cells following stimulation by CM collected from CAFs expressing a control shRNA or a p38α shRNA for the indicated time. Values represent relative band intensity of p-PGM1 normalized to total PGM1 and fold change relative to the control CM sample. Images are representative of 4 biological replicates. (G) Proliferation of TYK-nu cells exposed to CM from primary CAFs expressing a control shRNA versus CAFs expressing a p38α shRNA. Data is representative of 2 independent experiments. Values are mean + SEM (n=6/group), ***p<0.001. (H) Boyden chamber invasion assay of TYK-nu treated with CM from either primary CAFs expressing a control shRNA or p38α shRNA. Values are mean + SEM from 3 independent experiments (n=3/group/experiment), **p< 0.01. (I) In vivo tumor growth of SKOV3ip1-Luc cells injected alone (n=6) or co-mixed with either primary CAFs expressing a control shRNA (n=8) or a p38α shRNA (n=8) and then injected subcutaneously into the flanks of female athymic nude mice. Bioluminescence imaging is shown over time. Comparisons were made using a repeated measure Two-way ANOVA (**p<0.01 for matching across groups) and Tukey’s multiple comparisons post-test was used to compare each group at day 21, **p< 0.01. (J) PAS staining of sub-cutaneous (SQ) tumors from experiments in Figure 5I. Left, quantification of percent of tumor area staining positive for PAS with background staining (distase insensitive areas, see methods) removed. Values are mean + SEM (n=6–8/group), *p< 0.05. Right, representative images of PAS staining in tumors from each group. Scale bar = 100µm.
