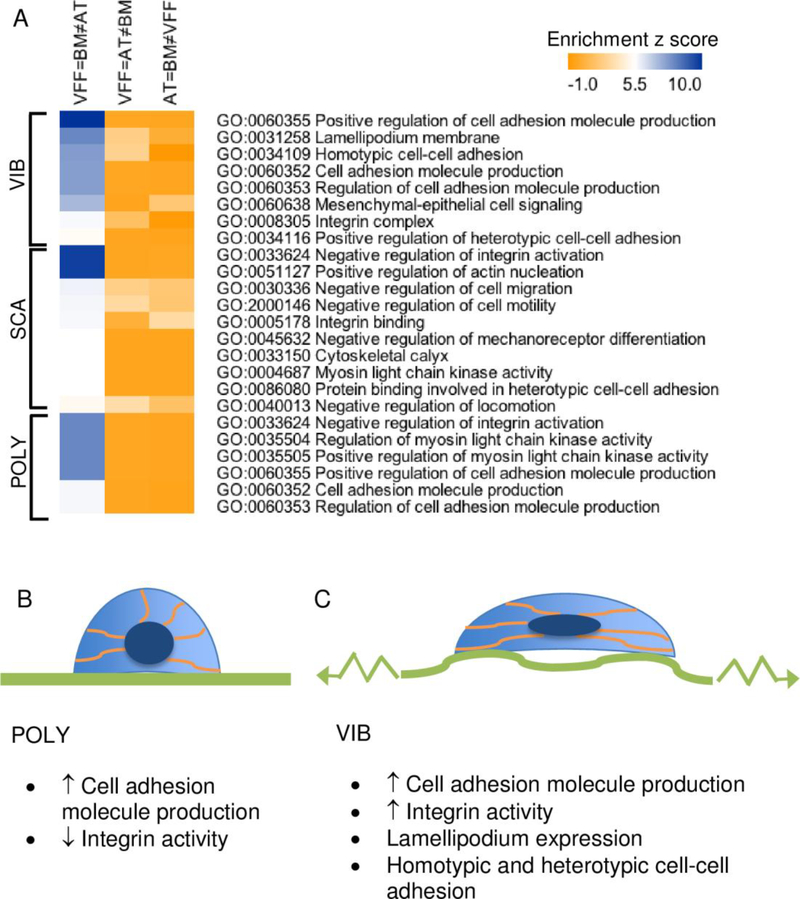
Fig 3. Vibrated VFF shared more mechanotransductive similarity with BM-MSC than AT-MSC.
Heat map of the significant GO terms related to mechanotransduction from pattern 2 (AT=BM≠VFF), 3 (VFF=AT≠BM), and 4 (VFF=BM-MSC≠AT-MSC) is provided for VIB, SCA, and POLY data (A). This expression pattern was selected based on the significant KEGG findings. Expected changes to the cell shape (lighter blue), orientation of the actin cytoskeleton (orange), and nucleus (dark blue) for VFF and BMMSC grown on B) polystyrene (POLY), or C) a cell scaffold and exposed to vibratory strain (VIB) are depicted based on GO analyses. Significant GO terms are listed below each schematic from expression pattern 4 (VFF=BM≠AT) for the VIB and POLY data.

